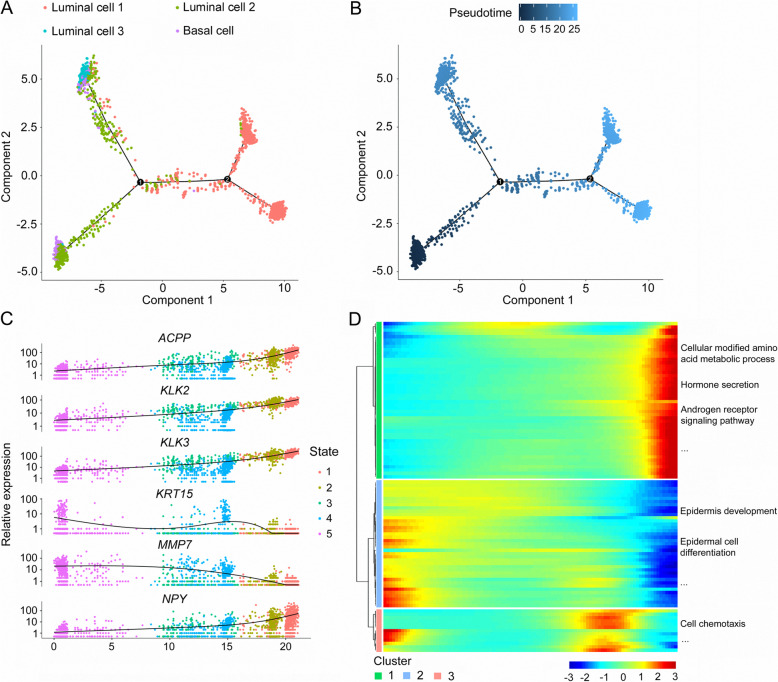
Fig. 4.
Reconstructing the pseudotime trajectory of cancer cells using basal and luminal cells, and identifying genes varied during the trajectory. a Pseudotime trajectory of basal cells and 3 types of luminal cells was generated by Monocle2. Red spots represent type 1 luminal cells; green spots represent type 2 luminal cells; blue spots represent type 3 luminal cells; purple spots represent basal cells. b Pseudotime was colored in a gradient from dark to light blue. The start of pseudotime is indicated by dark blue, the end of pseudotime by light blue. c Basal and luminal cells were divided into 5 states by featured gene expression profiles. Top six DEGs with expression levels that changed the most over pseudotime trajectory were identified and shown as dot plots representing as expression level. d Top 100 DEGs with expression levels that changed the most over the pseudotime trajectory were divided into 3 clusters based on their expression trend, and the representative processes of each cluster are shown. Color key from blue to red indicates relative expression levels of top 100 DEGs from low to high

