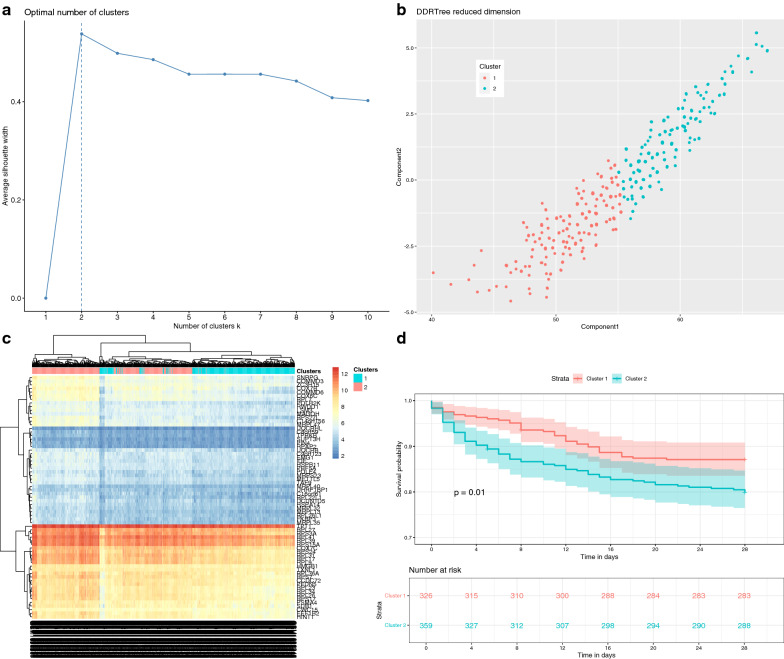
Fig. 10.
The survival analysis with the light-yellow module. a Optimal number of classes derived from DDRTree reduced dimension space with the silhouette width; the two-class model was the best fit model with the highest silhouette width. b Discriminative dimension reduction (DDR) graph of the light-yellow module gene list. K-means clustering was used to separate samples into two groups (blue and red). c Heatmap of gene expression sorted by DDR score. The two clusters identified by the DDR score were consistent with that identified by light-yellow module genes. Genes showing on the right were those from the light-yellow module. d Kaplan–Meier curves for groups defined by DDR k-means clustering of light-yellow module genes. Cox’s proportional hazard modelling of module groups showed that the cluster membership was significant association with survival (p = 0.01)

