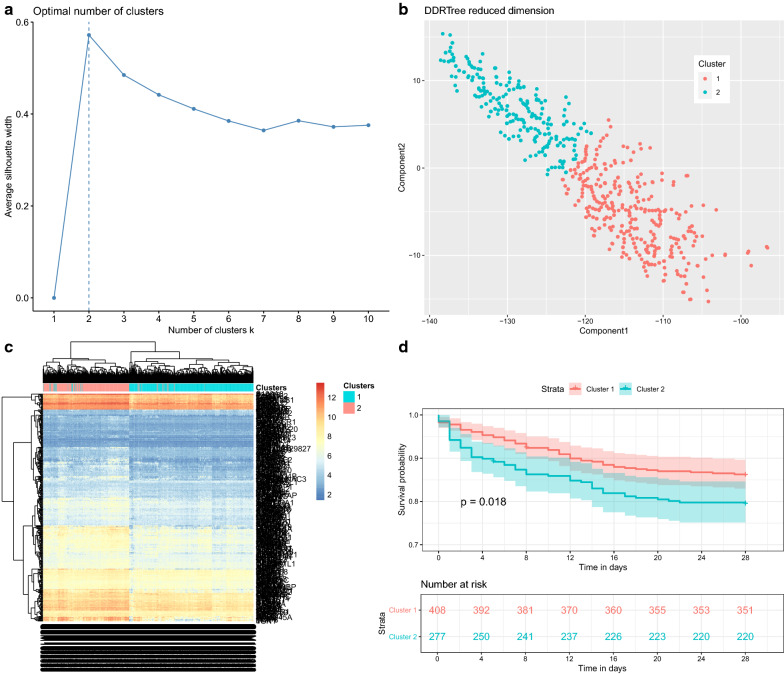
Fig. 8.
The survival analysis with the black module. a Optimal number of classes derived from DDRTree reduced dimension space with the silhouette width; the two-class model was the best fit model with the highest silhouette width. b Discriminative dimension reduction (DDR) graph of the black module gene list. K-means clustering was used to separate samples into two groups (blue and red). c Heatmap of gene expression sorted by DDR score. The two clusters identified by the DDR score were consistent with that identified by black module genes. Genes showing on the right were those from the black module. d Kaplan–Meier curves for groups defined by DDR k-means clustering of black module genes. Cox’s proportional hazard modelling of module groups showed that the cluster membership was significant association with survival (p = 0.018)

