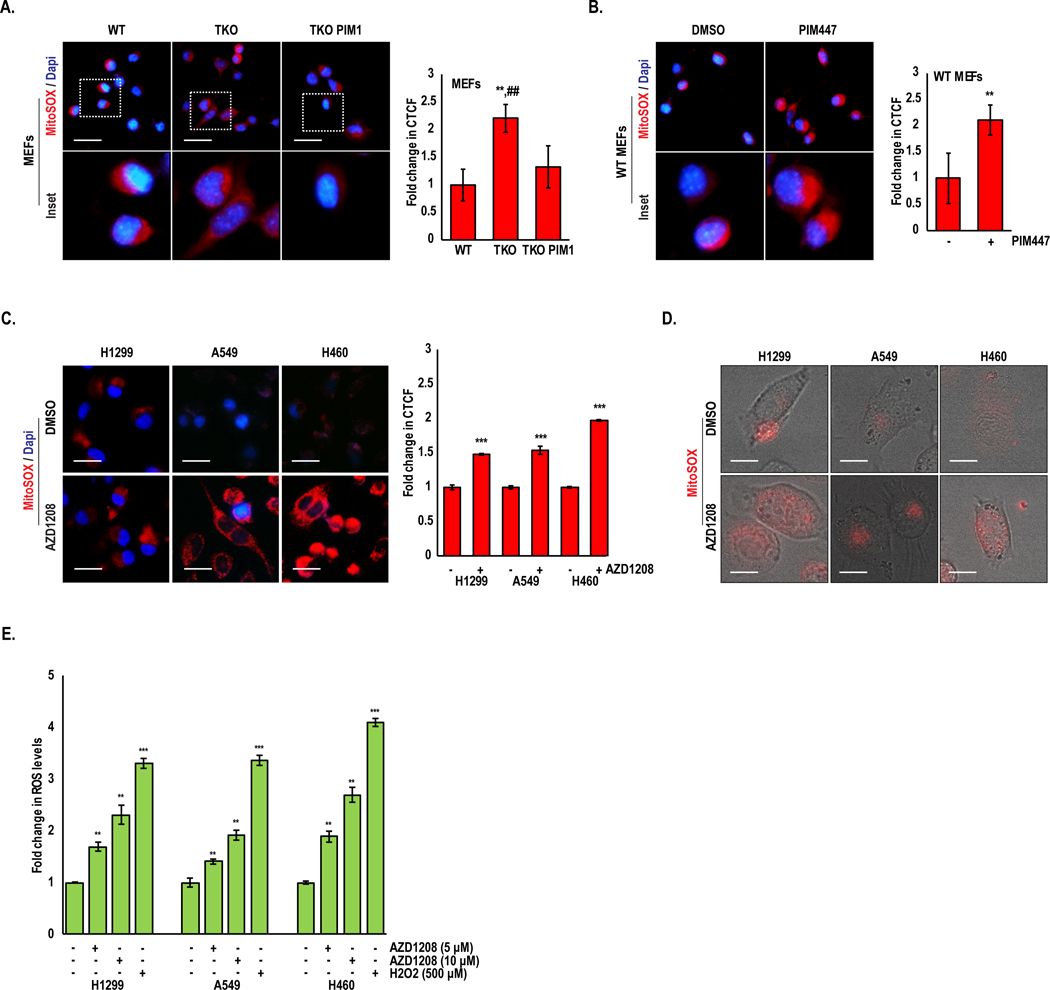
Figure 2. PIM inhibition increases mitochondrial superoxide production and total cellular ROS:

(A) Mitochondrial ROS was detected by MitoSOX staining in WT, TKO, and TKO-PIM1 MEFs and (B) WT MEFs treated with PIM447 (3 μM) for 24 h. (C) The indicated lung cancer cells were treated with AZD1208 (5 μM) for 24 h, and (D) MitoSOX staining was quantified as the fold change in CTCF. Representative micrographs of live cell imaging of MitoSOX (red) staining in lung cancer cells treated with AZD1208 (5 μM) for 2 h. (E) Fold change in ROS levels as measured by EPR in lung cancer cells treated as indicated; ROS levels, nM/min/mg protein; mean ± SD of three independent experiments. **, p<0.01 vs WT MEFs; ##, p<0.01 vs TKO MEFs; *, p<0.05, **, p<0.01, ***, p<0.001 vs DMSO. Scale bars, 20 μm.
