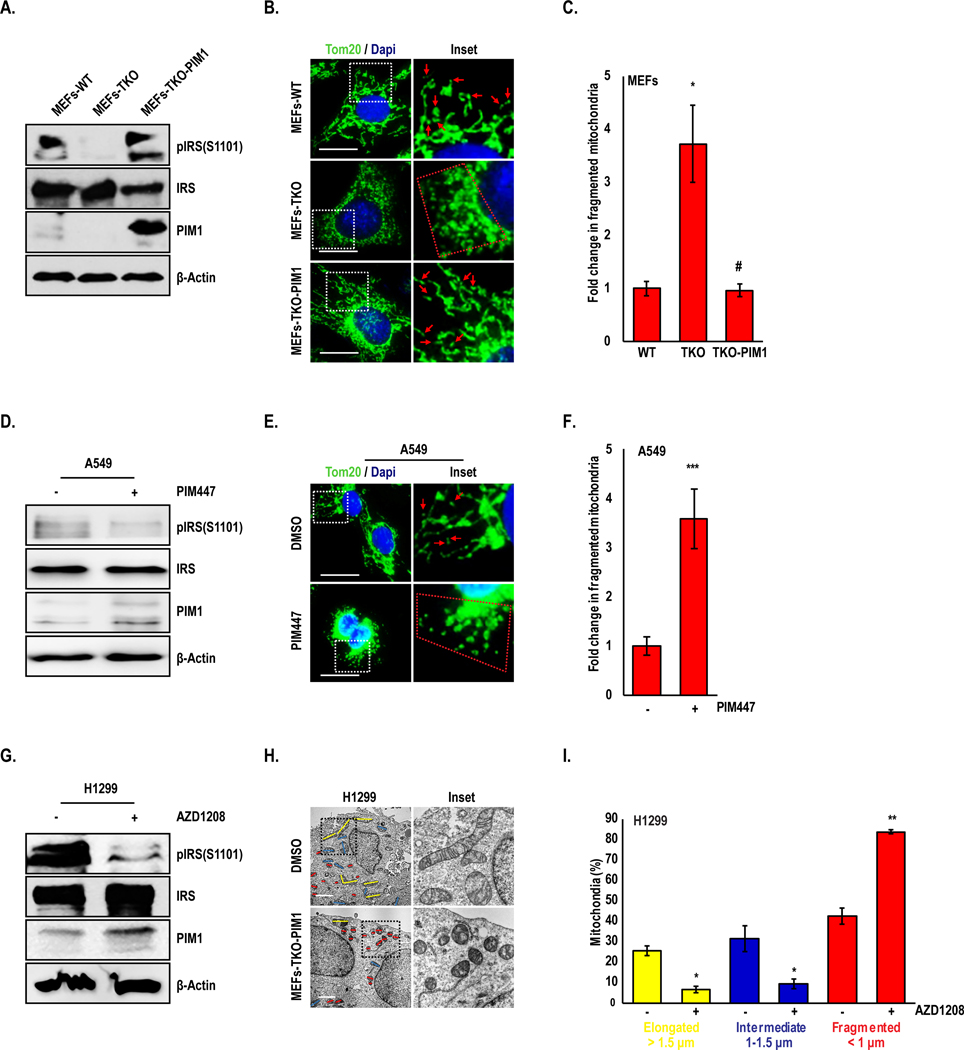
Figure 3. Loss of PIM induces mitochondrial fragmentation:

(A) Representative western blots showing PIM levels and activity in MEFs. (B) Mitochondrial phenotype was assessed by TOM20 immunofluorescence (green), (C) and fragmented mitochondria (< 1 μm) were quantified (red arrowheads and mitochondria within red dotted line indicate fragmented mitochondria. (D-F) A549 cells were treated with PIM447 (3 μM) for 24 h and mitochondrial phenotype was assessed by TOM20 staining. (G) H1299 cells were treated with AZD1208 (5 μM) for 24 h, and (H) mitochondria were imaged by TEM. (I) Percentage of mitochondria with elongated (> 1.5 μm, yellow), intermediate (1–1.5 μm, blue) and fragmented (< 1 μm, red) mitochondria were quantified. Results are expressed as mean ± SD of three independent experiments. *, p<0.05 vs WT MEFs; #, p<0.05 vs TKO MEFs; *, p<0.05, **, p<0.01, ***, p<0.001 vs DMSO. Scale bars, 20 μm.
