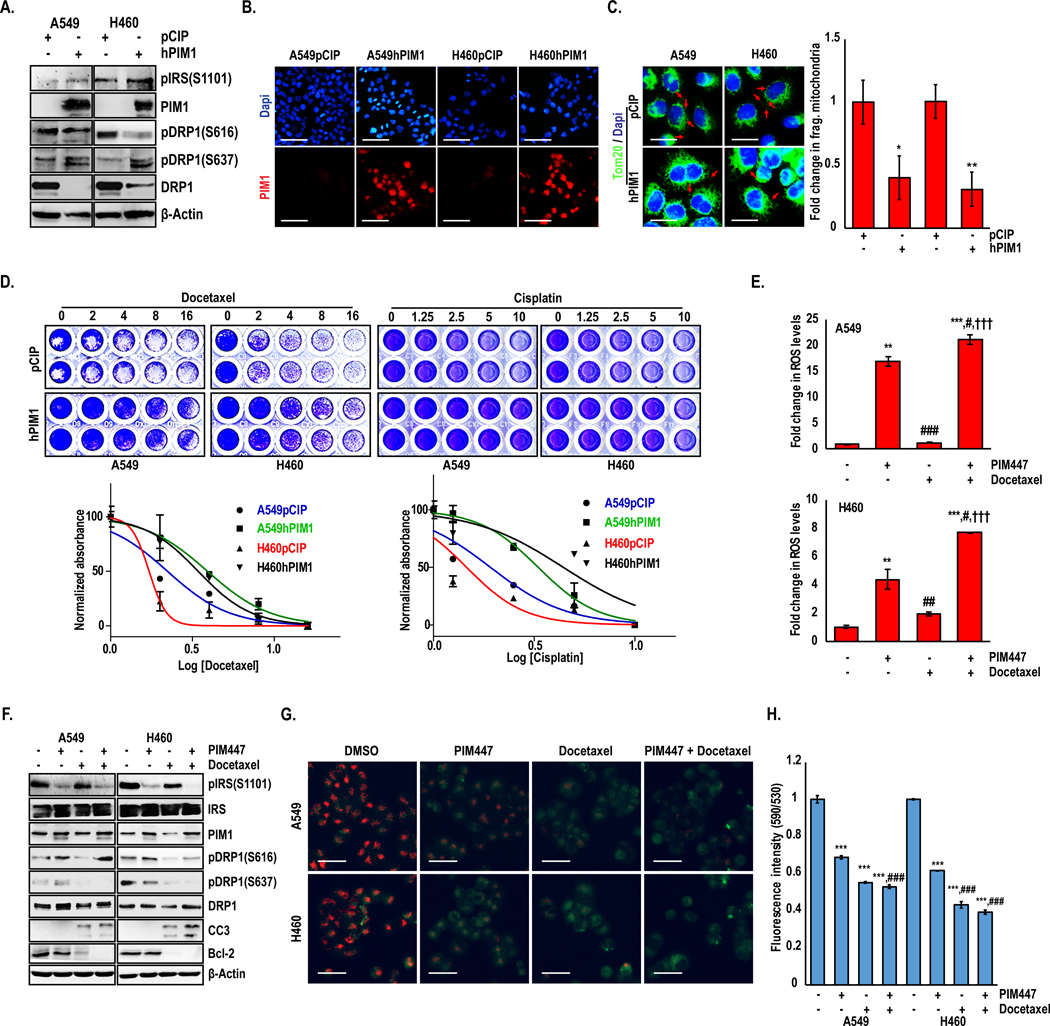
Figure 5. PIM inhibition sensitizes lung cancer cells to chemotherapy by altering the mitochondrial phenotype.

Stable PIM1 overexpression in lung cancer cells confirmed by (A) western blotting and (B) Immunofluorescence analyses. (C) Mitochondrial phenotype assessed by TOM20 immunofluorescence (green) in A549 and H460 cells with PIM1 overexpression. Magnification 60X; scale bars, 20 μm. (*, p<0.05; **, p<0.01 vs pCIP transfected line). (D) Crystal violet cell viability assay and drug IC50 quantification in lung cancer cells after 72 h docetaxel or cisplatin treatment. (E) Flow cytometric analysis of H2DCFDA intensity representing ROS levels in A549 and H460 cells treated with PIM447, docetaxel, or the combination. (F) Immunoblot analysis of A549 and H460 cells treated with PIM447 (3 μM), docetaxel (3 nM), or the combination. (G) Live cell micrographs of JC-1 aggregates in A549 and H460 cells treated with PIM447, docetaxel, or the combination (Scale bars, 40 μm), and (H) JC-1 staining was quantified using a fluorescence plate reader. Values are mean ± SD of 3 independent experiments. **, p<0.01, ***, p<0.001 vs DMSO; #, p<0.05, ##, p<0.01, ###, p<0.001 vs PIM447; and †††, p<0.001 vs Docetaxel.
