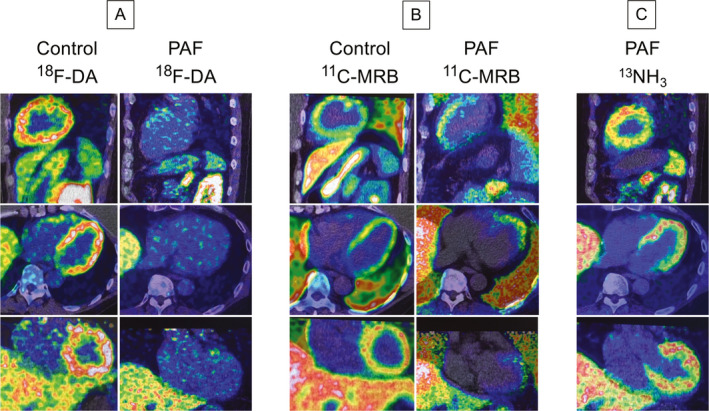
Figure 3.

Representative 18F‐DA, 11C‐MRB, and 13NH3 positron emission/computed tomographic (PET/CT) scans. Shown are cell phone screen shots of fused images displayed on the PET/CT scanner monitor, with spectral color scales in each image adjusted so that the minimum radioactivity is black and maximum white. Top images are sagittal, middle transaxial, and bottom coronal views. Images for 18F‐DA and 13NH3 scans were from the dynamic scanning frames from 5‐10 minutes after initiation of 3‐minute tracer infusion. Images for 11C‐MRB were from a static scan 15‐30 minutes after initiation of 3‐minute tracer infusion. A, 18F‐DA scans in a control subject and a PAF patient. B, 11C‐MRB scans in the same control subject and PAF patient. C: 13NH3 scans in the same PAF patient as in A and B, documenting normal myocardial perfusion. In the PAF patient septal 18F‐DA‐derived radioactivity at the bottom of the heart was 28% of control, whereas 11C‐MRB‐derived radioactivity was 94% of control.
