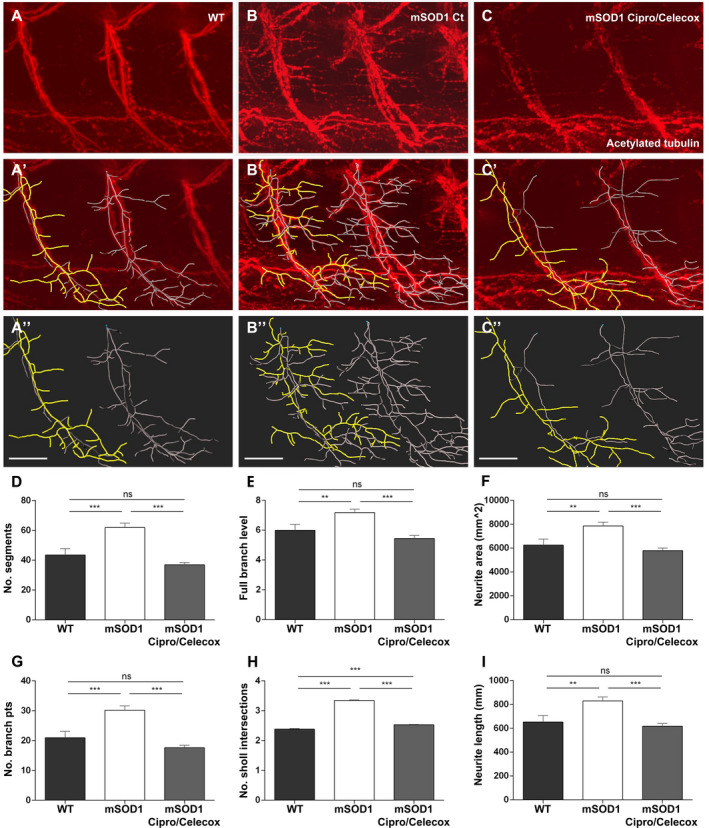
Figure 3.

Cipro/Celecox treatment fully recovered mSOD1 axonopathy. (A‐C) 3D reconstructed apotome z‐stack images of branching motor neurons in the trunk of 6dpf larvae immunostained with antiacetylated tubulin antibodies (segments S10‐ S12). (A'‐C'') The backbone (colored processes) of the motor neurons traced with the Filaments analysis of Imaris software. In yellow‐ single motor neuron. WT (A–A''), control mSOD1 (B‐B'') and 100 µmol/L Cipro/ 1 µmol/L Celecox‐ treated mSOD1 larvae (C–C''). (scale bars = 40 µm). (D–I) Morphometric analysis measurements of individual motor neuron in WT, mSOD1 control and mSOD1 treated with 100 µmol/L Cipro/ 1 µmol/L Celecox. Graphs indicate (D) number of segments, (E) full branch level, (F) neurite area, (G) number of branch points, (H) number of Sholl's intersections and (I) neurite length. (ns = non significant; **P < 0.01; ***P < 0.001; one‐way ANOVA, Tukey post hoc test, n = 15 for control and treated mSOD1 fish and n = 11 for WT fish).
