
Figure 3.
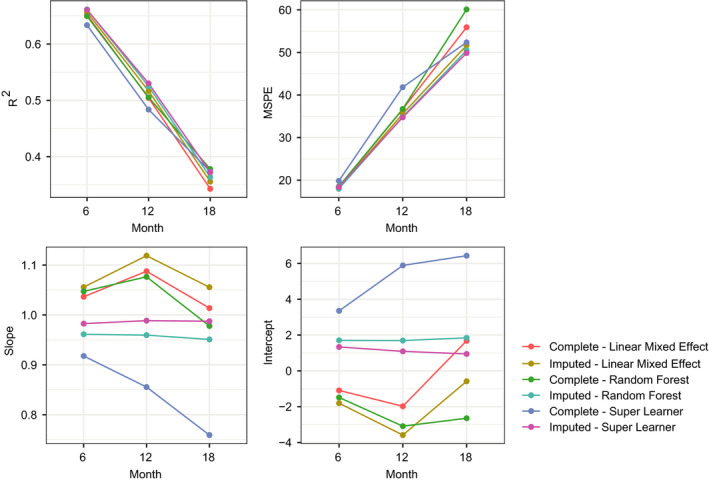
Prediction results for olesoxime data stratified by month. Each dot shows the mean squared prediction error (MSPE) of the predictions or R 2, slope and intercept of a linear model regressing actual ALSFRS‐R on predicted values.
Official websites use .gov
A
.gov website belongs to an official
government organization in the United States.
Secure .gov websites use HTTPS
A lock (
) or https:// means you've safely
connected to the .gov website. Share sensitive
information only on official, secure websites.
Prediction results for olesoxime data stratified by month. Each dot shows the mean squared prediction error (MSPE) of the predictions or R 2, slope and intercept of a linear model regressing actual ALSFRS‐R on predicted values.