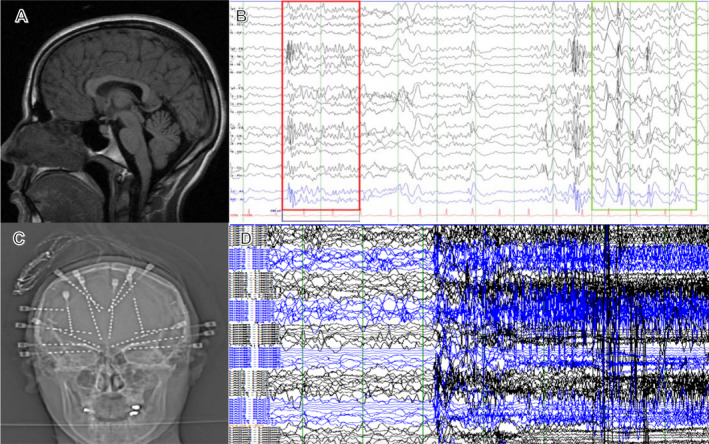
Figure 1.

(A) MRI T1‐sagittal view demonstrating mild callosal dysgenesis but no focal abnormality; (B) Scalp EEG showing LGS pattern of underlying paroxysmal fast activity (red rectangle) and slow spike and wave (green rectangle); (C) AP X‐ray of the skull displaying relative mirror image stereotactic EEG electrode placement, with investigation of frontal, temporal, and insular networks; (D) sEEG showing generalized seizure pattern (black‐left hemisphere; blue‐right hemisphere).
