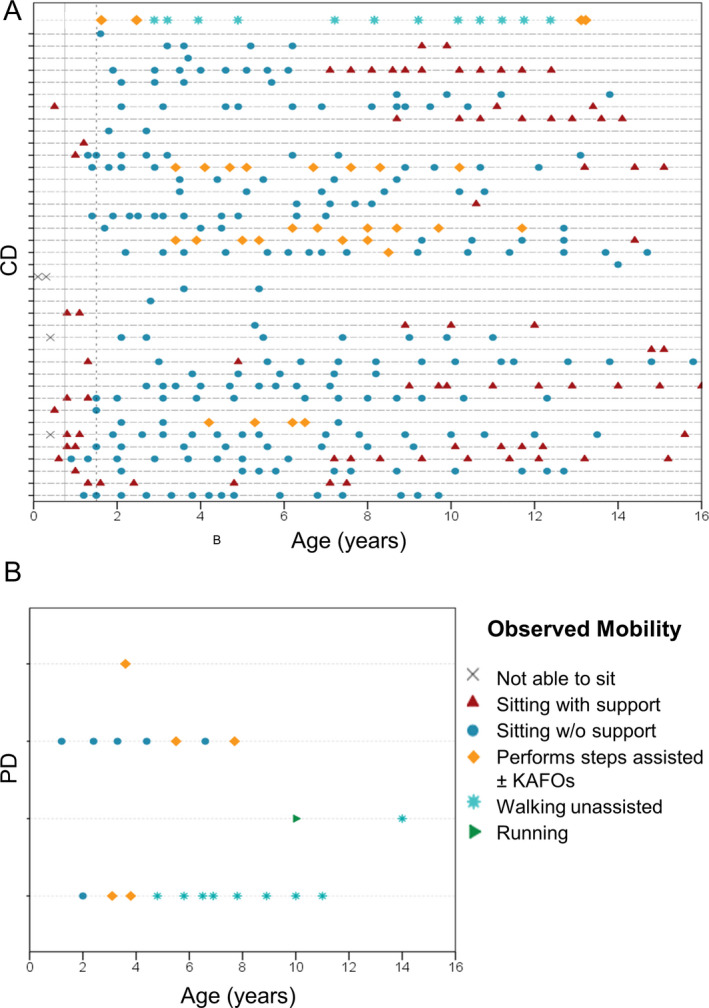
Figure 2.

Longitudinal observational data on gross motor abilities in LAMA2‐RD patients. Each horizontal line indicates single patients. Symbol on lines indicates different assessments in each patient. Panel A: patients with severe phenotype/complete deficiency (CD). Panel B: patients with milder phenotype/partial deficiency (PD). Cross: not able to sit with support; triangle: sitting with support, circle: sitting without support; diamond: walking with support; asterisk: walking alone; arrowhead: running. The continuous vertical line at 9 months and dashed line at 18 months indicates WHO thresholds for attaining independent sitting and walking alone in 99% of children.
