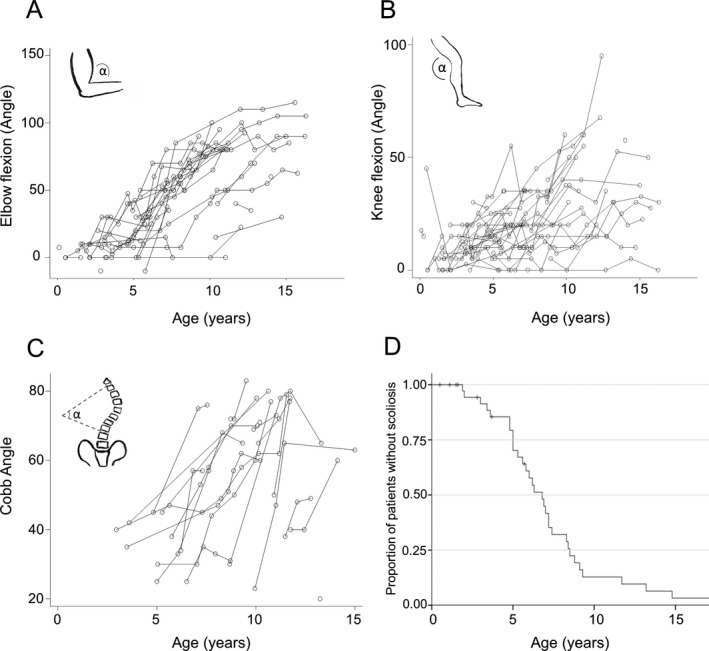
Figure 3.

Orthopedic complications. (A‐B) Line charts representing contracture progression by age of right elbow flexion and right knee flexion, as measured by goniometric angle. (C) Line chart representing Cobb Angle° changes by age and (D) Kaplan–Meier estimates for scoliosis onset from birth. Right‐censored data (subject alive without event occurrence at last follow‐up) were indicated with vertical tick‐marks. Only CD patients were considered for analysis.
