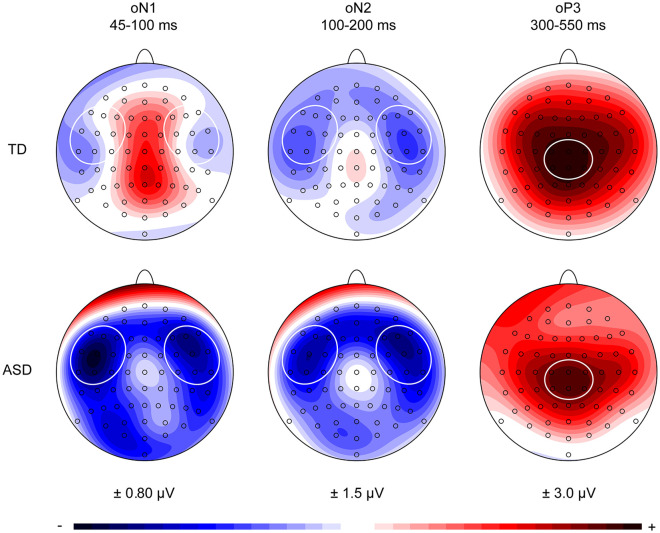
Figure 3.
Scalp potential maps of the group-averaged visual-corrected auditory omission responses in the denoted oN1 (45–100 ms), oN2 (100–200 ms), and oP3 (300–550 ms) time windows. Based on these scalp distributions, a left-temporal (F7, F5, F3, FT7, FC5, FC3, T7, C5, C3) and right-temporal (F4, F6, F8, FC4, FC6, FT8, C4, C6, T8) region of interest were selected for the oN1 and oN2 time windows. A central-parietal (C1, Cz, C2, CP1, CPz, CP2) region of interest was selected for the oP3 time window.

