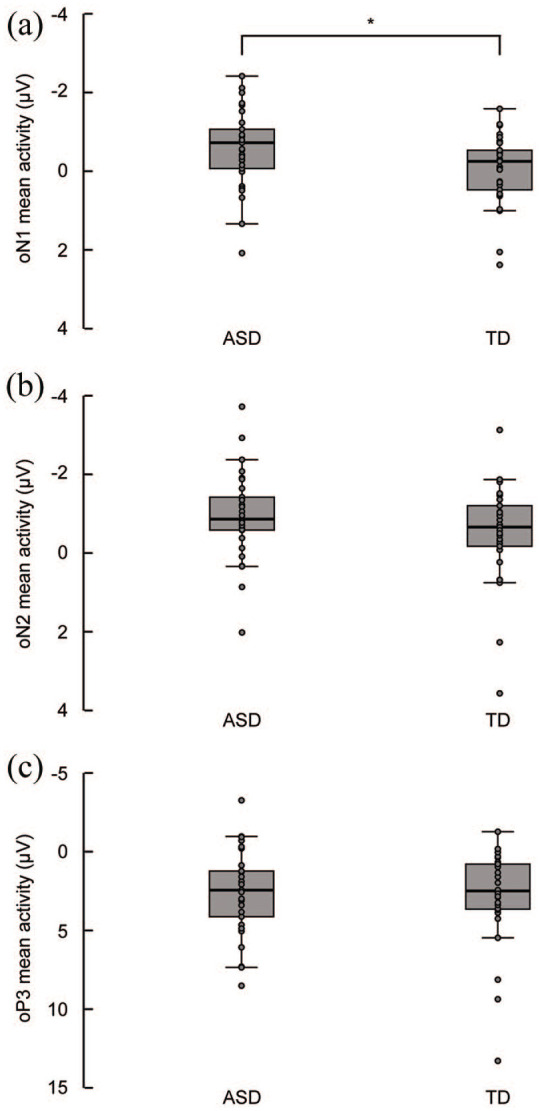
Figure 4.

Boxplots displaying the group medians and interquartile ranges overlaid with individual data points of the visual-corrected auditory omission responses for the ASD and TD group in the denoted oN1 (45–100 ms), oN2 (100–200 ms), and oP3 (300–550 ms) time windows averaged across regions of interest and electrodes. (a) The mean activity in the oN1 time window was significantly more negative in the ASD group compared to the TD group. (b and c) The mean activity in the oN2 and oP3 time windows was similar in both groups.
