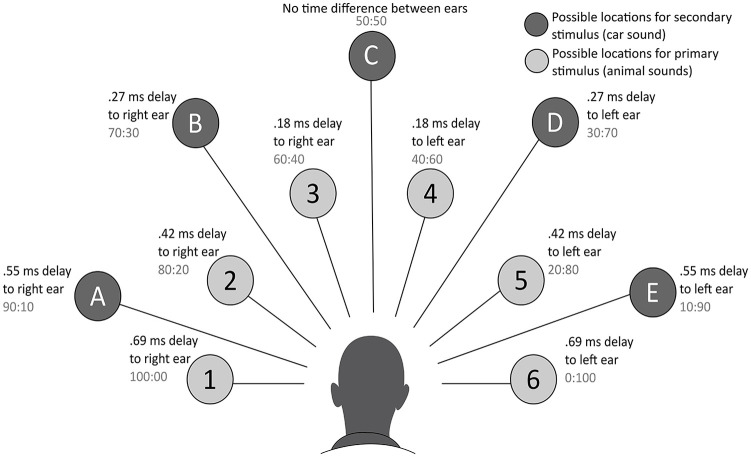
Figure 1.
Auditory load task developed by (Fairnie et al., 2016). Possible locations of the animal sounds were placed in the numbered circles 1–6 in the inner ring, whereas circle A–E on the outer ring represents possible locations of the critical stimulus. The sound of the critical stimulus was 9 dB quieter than the sounds of the target stimulus. The milliseconds next to the circles are the interaural time differences, the time the sound needs to travel to the contralateral ear. The ratios (in grey) represent the interaural amplitude difference – the relative amplitude difference between the ears.

