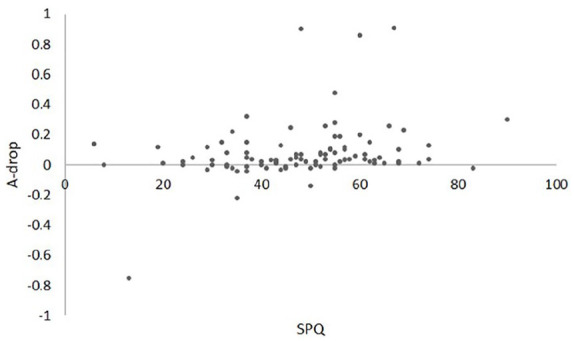
Figure 3.

Scatterplot of SPQ score and the descent in detection sensitivity between set size 1 and 6 (A-drop). Note: Negative, constant or small positive values of A-drop from set size 1 to 6 reflect higher perceptual capacity. For the SPQ, the lower scores indicate higher sensory.
