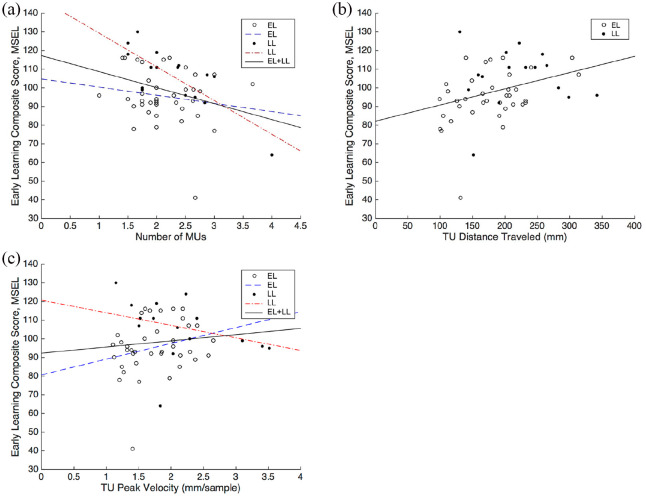
Figure 6.
(a) Scatterplot of number of movement units (MU) against the Early Learning Composite Score on the MSEL with separate regression lines for each group (due to the significant interaction term; see main text for details). (b) Scatterplot of distance traveled (of the TU) against the Early Learning Composite Score on the MSEL with a regression line for the total sample. (c) Scatterplot of peak velocity (of the TU) against the Early Learning Composite Score on the MSEL with separate regression lines for each group. Full circles represent trials of LL infants, whereas open circles represent trials of EL infants.

