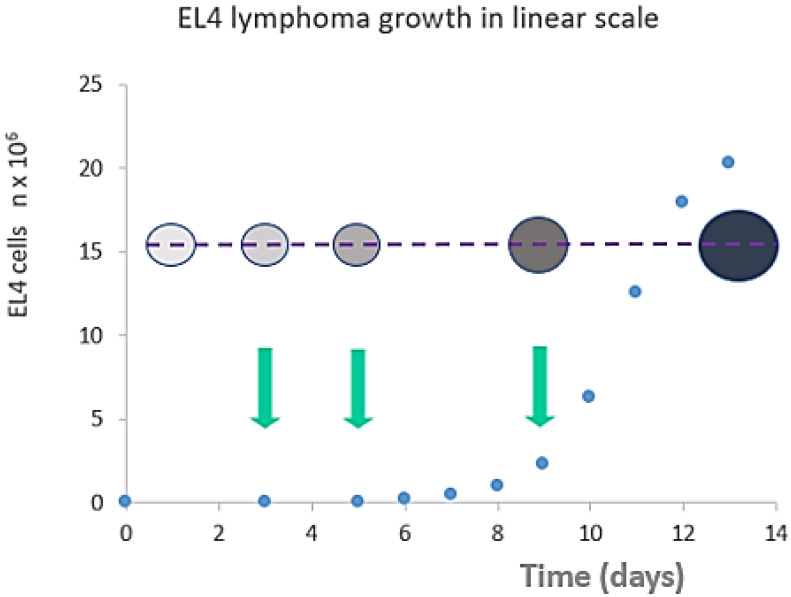
Figure 2.
Tumor size (cell counts - blue dots) vs animal weight (bubble diameter) vs cell density (bubble color intensity) in peritoneal exudate cells following tumor transplantation. Arrows indicate selected treatment days (day 3 “cure”, day 5 “relapse” or day 9 “resistance”) for Dox injection. Unlike the late stage (day 13) tumors, early stage (days 1-9) tumors did not exhibit a significant increase in mice weight or an increase in ascites volume. Despite this, the response to Dox administration is significantly different at different points in time as well as tumor cell density in the early stage.

