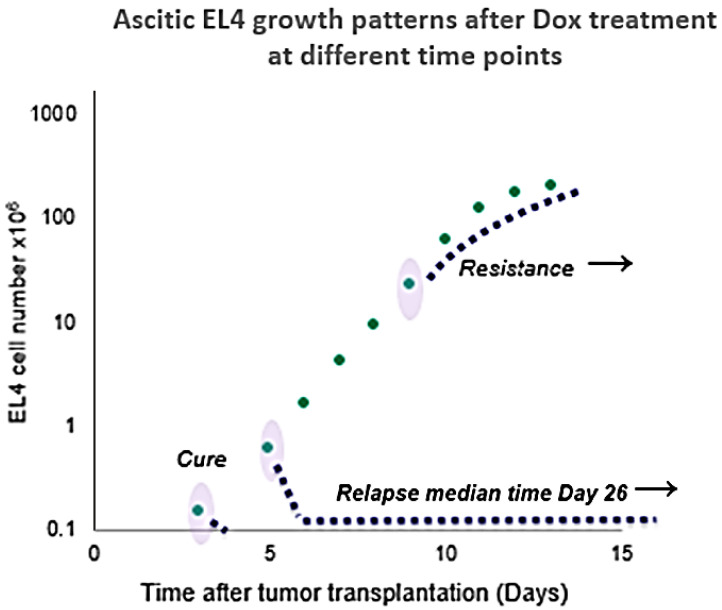
Figure 3.
Response to Dox treatment at different points in time (days 3, 5, and 9) after tumor transplantation. Tumor cell counts are shown in log scale to visualize the miniscule difference in tumor size at the early stage of growth. Absolute cell numbers with standard error values are shown in the adjacent table. Table is adjacent to a scatterplot to indicate standard error of cell counts of all tested days. Dox injection days and corresponding tumor cell numbers are highlighted in the table.

