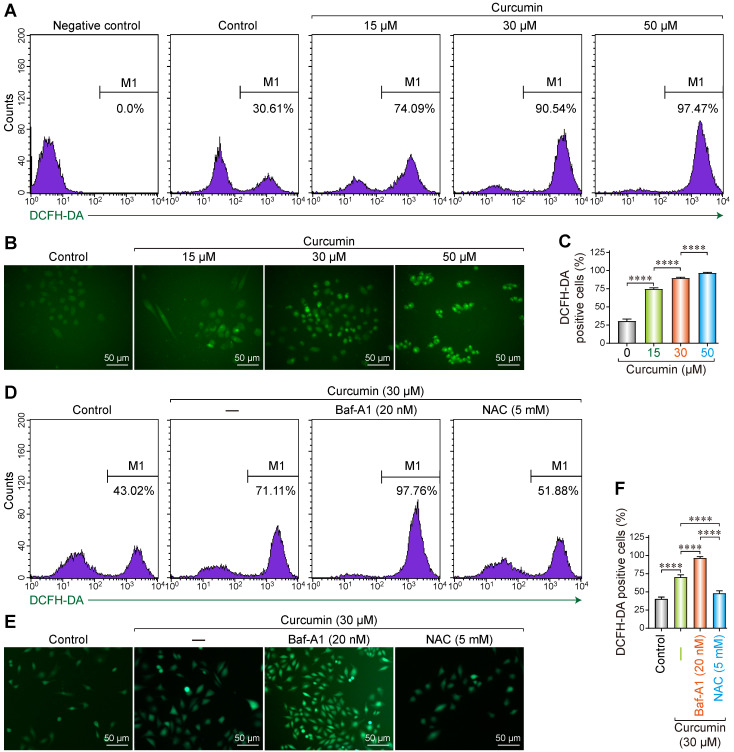
Figure 1.
Reactive oxygen species generation in curcumin treated siha cells. (A) Siha cells treated with curcumin in a concentration-dependent manner, then flow cytometry was used for detection of fluorescence. Positive cells are given on each image. (B) Representative photomicrograph of ROS measurement through DCF-DA. Siha cells were treated with curcumin of different concentrations for 24 h, incubated with DCF-DA (10 µM) for 30min and ROS levels were determined as described under a fluorescent microscope.(C) The densitometric measurements of the florescence images were plotted in graph taking Mean and ±SEM and statistical analysis were carried out using one-way ANOVA (p < 0.001 vs control). (D) Siha cells were treated with curcumin 30 µM for 24 h, Cur combination with Baf-A1 (20 nM), Cur combination with NAC (5 mM), then flow cytometry was used for detection of fluorescence. Positive cells are given on each image. (E) Representative photomicrograph of ROS measurement through DCF-DA. (F) Significant differences were noted in all comparisons: control versus Cur only, Cur only versus Cur+Baf-A1 (20 nM), Cur only verus Cur+NAC (5 mM).

