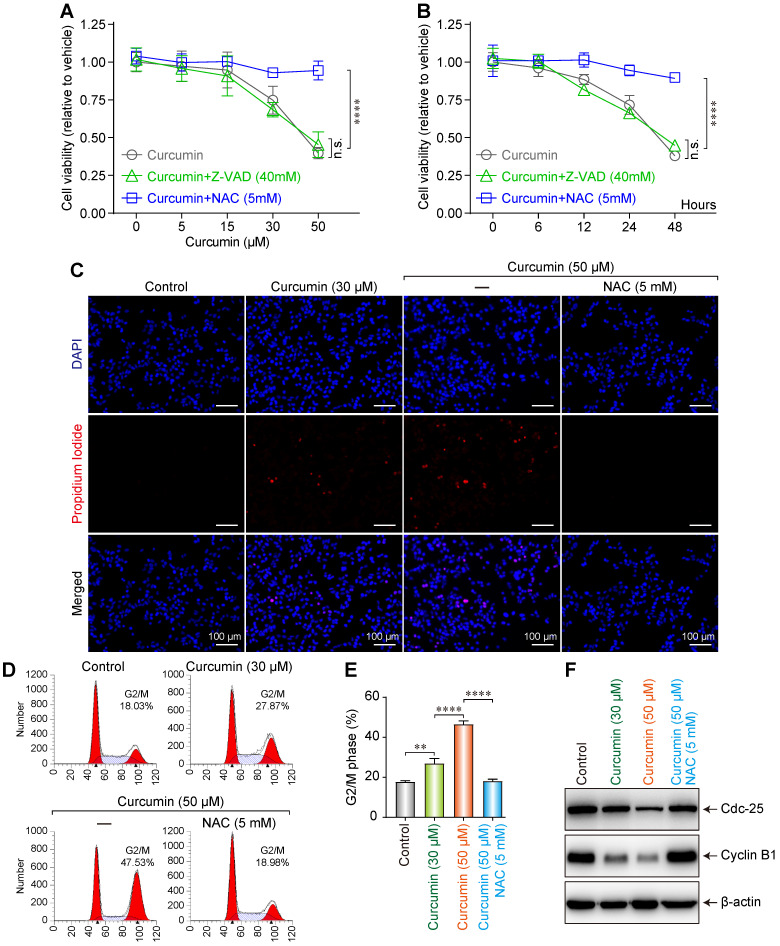
Figure 2.
Dose-dependent influence of curcumin on siha cells. (A) Viability of siha cells treated with the indicated concentrations of curcumin for 24 h measured by CCK-8 assay. (B) Cells treated with 40 µM curcumin for 0,6,12,24,48Hours. Data are calculated as the percentage of control and represent mean (n=3). (C) Siha cells treated with curcumin (or with NAC), stained with PI and DAPI, observed under a fluorescent microscope. (D) Cell cycle analysis of curcumin-treated cells for 24 h, concentrations as indicated. (E). Percentage of cells in each phase of the cell cycle: G1, S and G2/M were estimated after analysis using the modfit software and percentage of cells in G2/M fraction was measured using the CellQuest software. Graphs represent mean±SD (n=3 ). (F) Level of cdc25, cyclinB1 proteins estimated by western blotting. Whole-cell extracts were prepared 24h after treatment with different concentrations of curcumin (or with NAC). β-actin was used as a loading control.

