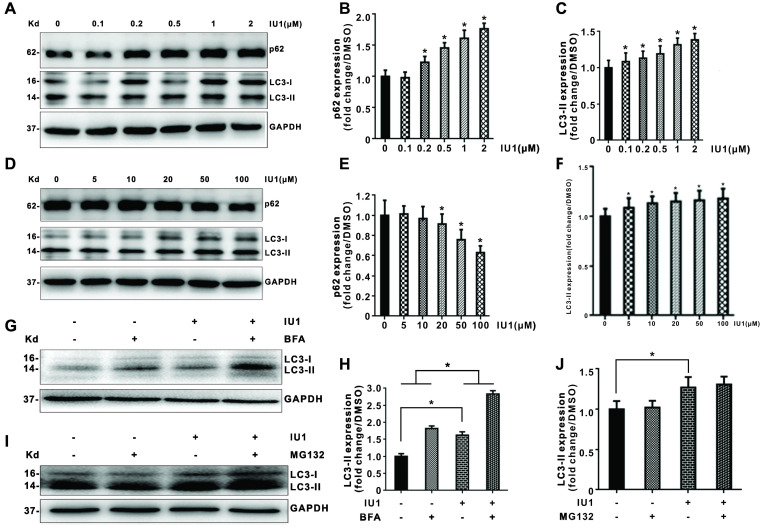
Figure 6.
Effect of IU1 on autophagy in HeLa cells. (A-F) Protein expression levels of p62 and LC3 (autophagy marker). Panels are the representative images of western blot. The expression levels of p62 and LC3-II were analyzed quantitatively in a bar graph. (G-J) Autophagic flux. Panels are representative western blot bands of LC3. The expression levels of LC3-II were analyzed quantitatively in a bar graph. The quantitative analyses of autophagic flux were shown. Autophagic flux was estimated by calculating the difference in LC3-II turnover between the experimental groups. Data are means ± SEM. (n = 3). * p<0.05, ** p<0.01 vs DMSO-treated control.

