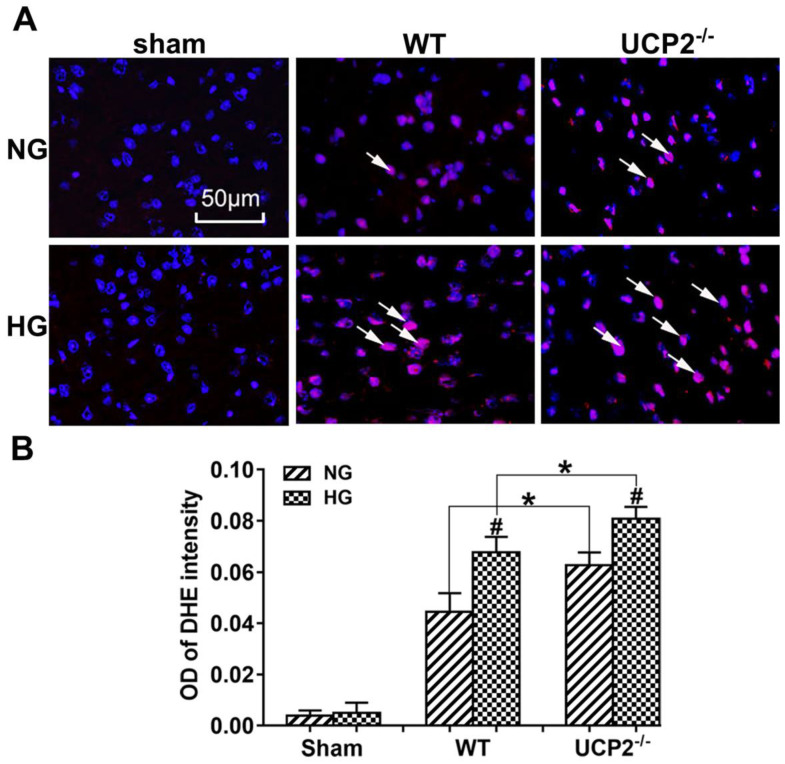
Figure 4.
UCP2 deletion enhanced ROS production in hyperglycemic mice. (A) ROS production detected by DHE in WT and UCP2-/- mice. Nuclei were labeled with DAPI. Magnification, 400X. Scale bar= 50 μm. (B) summarized DHE fluorescent intensity. n=4 mice per group. Data are presented as means ± SD. *p < 0.001 vs. WT group in same glucose and #p < 0.05 vs. NG group in some type of animal.

