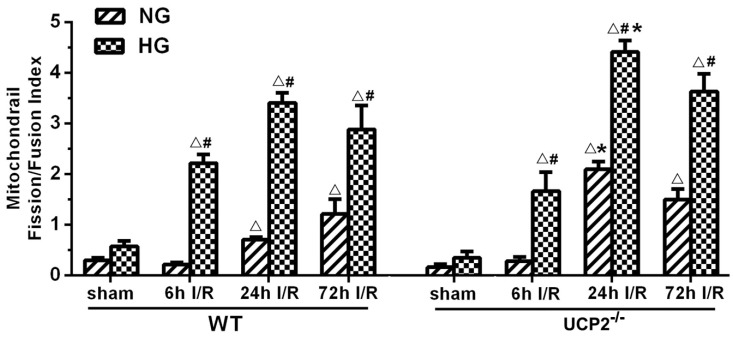
Figure 7.
Mitochondrial fission/fusion index following cerebral ischemia and reperfusion under both normo- and hyperglycemic conditions. Index represents the ratio of fission (Drp1 and Fis1) and fusion (Opa1 and Mfn2) proteins. Data are expressed as means ± SD. △p<0.05, vs. respective sham-operated controls, #p<0.05 vs. normoglycemic and *p<0.05 vs. WT counterpart at an identical reperfusion stage.

