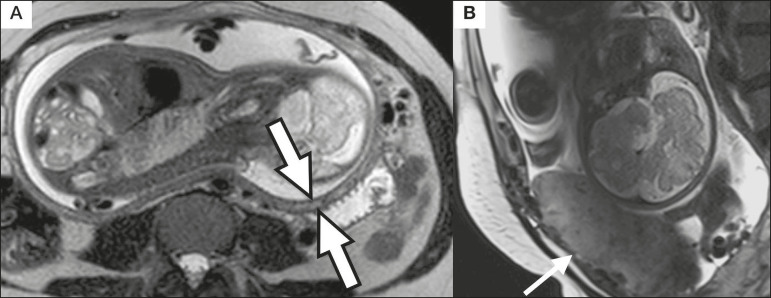
Figure 8.
A: Axial T2-weighted MRI sequence showing a normal trilaminar appearance of the myometrium, represented by the middle layer with high signal intensity whereas the outer and inner layers have low signal intensity (arrows). B: Sagittal T2-weighted sequence showing myometrial thinning with indistinct layers (arrow).

