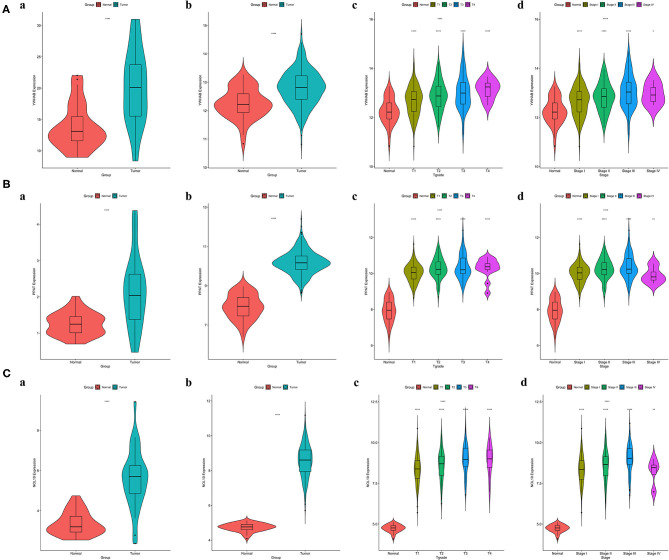
Figure 6.
Correlations between biomarker expression and progression of HCC. (A) YWHAB expression differences. (B) PPAT expression differences. (C) NOL10 expression differences. (a) between tumor and adjacent normal tissues in the FAHMSZU cohort. (b) between tumor and solid normal tissues in the TCGA-LIHC dataset. (c) between different T grades tumor and solid normal tissues in the TCGA-LIHC dataset. (d) between different stages tumor and solid normal tissues in the TCGA-LIHC dataset. (ns P ≥ 0.05; *P < 0.05; **P < 0.01; ****P < 0.0001).

