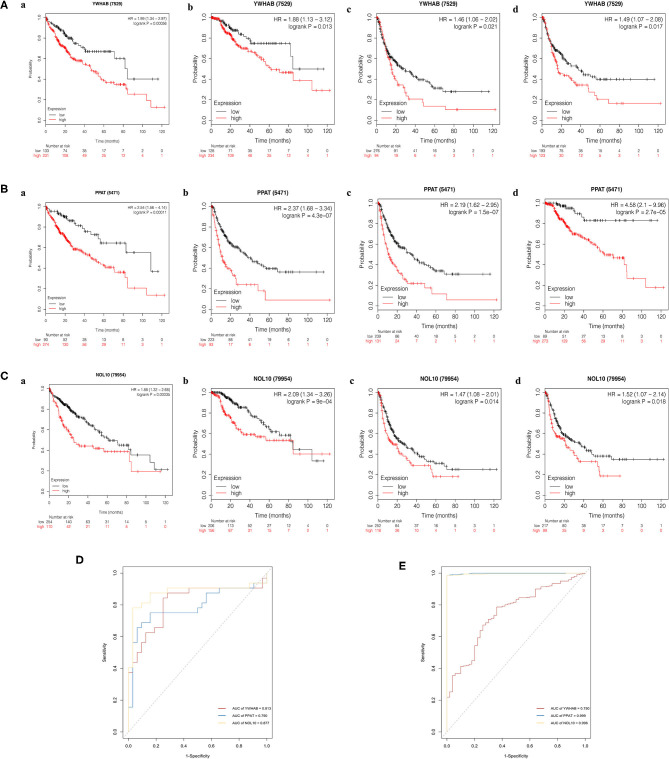
Figure 9.
Kaplan–Meier survival analysis of high- and low- expression samples. (A) YWHAB, (B) PPAT, and (C) NOL10. (a) Overall survival. (b) Disease-specific survival. (c) Post-progression survival. (d) Relapse-free survival. (D) Diagnostic ROC curves for YWHAB, PPAT, and NOL10 in the FAHMSZU cohort. (E) Diagnostic ROC curves for YWHAB, PPAT, and NOL10 in the TCGA-LIHC dataset.

