
Figure 1.
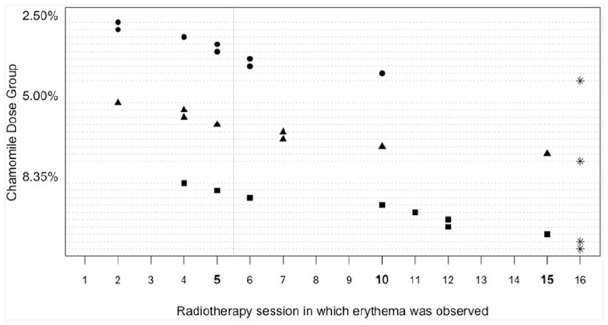
Time to development of erythema by concentrations of chamomile.
Each dashed line depicts the timeline for a person, with a marker at the radiotherapy session in which the erythema was first observed. Stars depict individuals who did not develop erythema by session 16. The vertical solid line depicts the average time for development for erythema when the usual cream of urea is used for prevention.