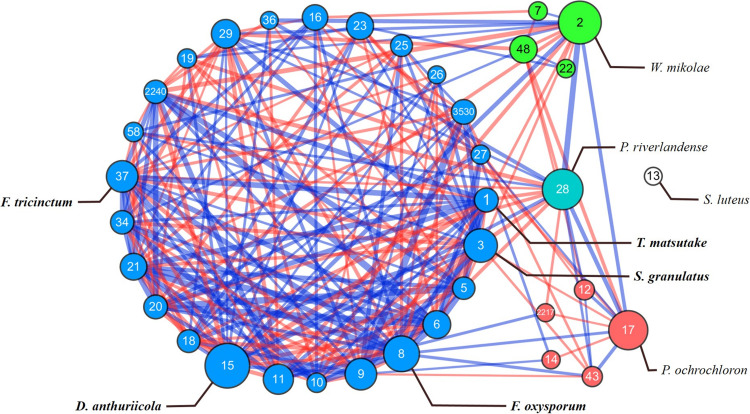
FIGURE 3.
SparCC network map in OTU level in microbiome of Pinus densiflora seedlings. Each point represents a fungal species; edges indicate the relationship between species. Each clusters are shown in different colors, with isolated species are marked with white. The size of the nodes follows betweenness centrality scores. The width of the edges follows SparCC correlation coefficients (blue: positive correlation; red: negative correlation). Species with total relative abundance higher than 0.5% were chosen. Only statistically significant edges corresponding to correlations with a magnitude higher than 0.3 (p < 0.05) were drawn. Identity of each OTU is described in Table 2.

