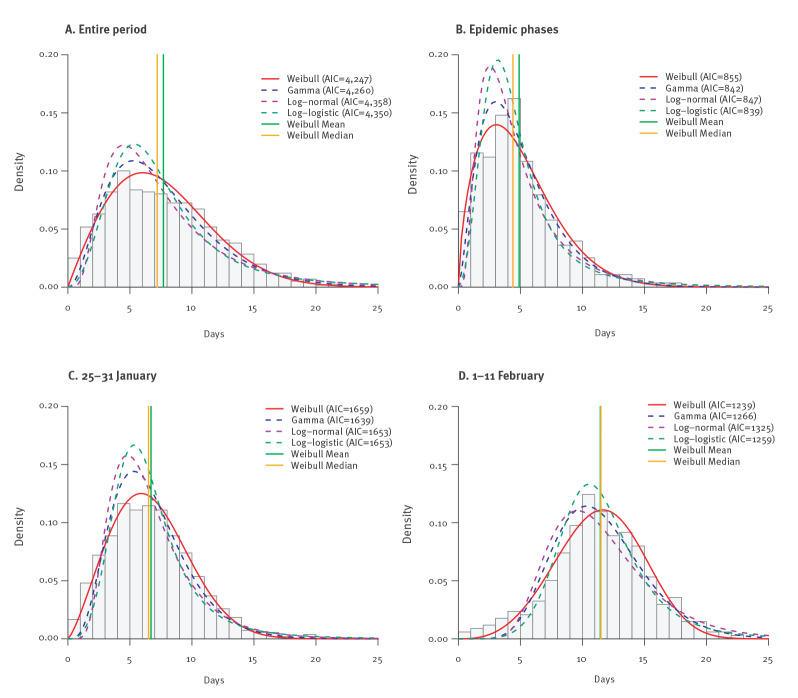
Figure 3.
Estimated distributions of the incubation period based on public data on COVID-19 cases, China, 1 January–11 February 2020 (n = 1,158)
AIC: Akaike's information criterion; COVID-19: coronavirus disease.
Epidemic phases are defined by date of symptom onset. Parametric models fitted are Weibull (red solid), gamma (blue dashed), log-normal (purple dashed) and log-logistic (green dashed). Density of observed distribution (using middle point of exposure interval as exposure time) is shown as the histogram. Vertical lines indicate mean (green) and median (orange) of the Weibull distribution.

