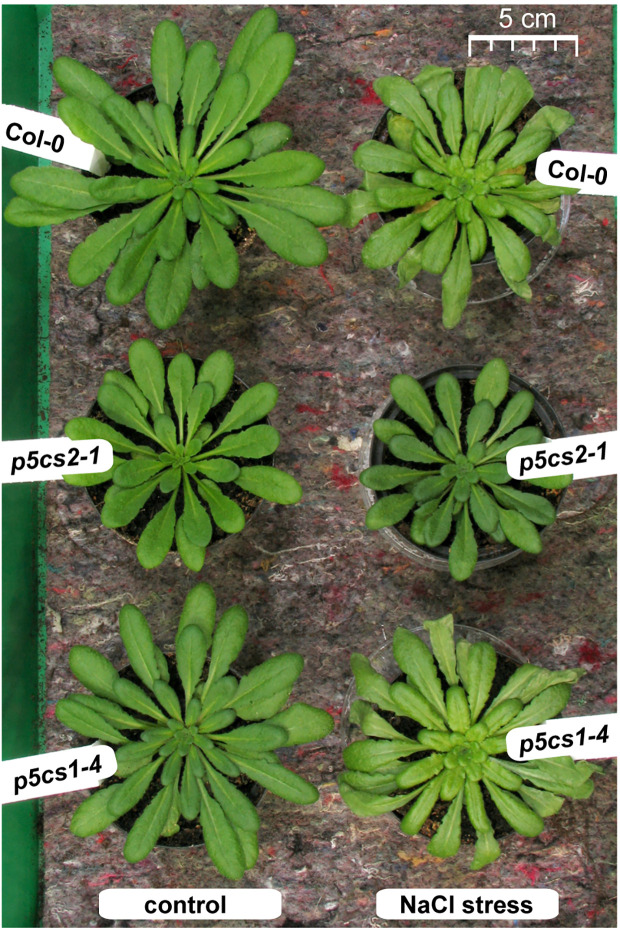
Figure 6.
Phenotype of p5cs mutant plants after salt stress. Six-week-old plants were stressed 4 and 2 days before the picture was taken with 25 ml per pot of a 300 mM NaCl solution whereas control plants received normal tap water. Note that the left half of the picture with the control plants was already published as Supplementary Figure S4 in (Funck et al., 2012) to illustrate the reduced rosette size of p5cs2-1 mutants.

