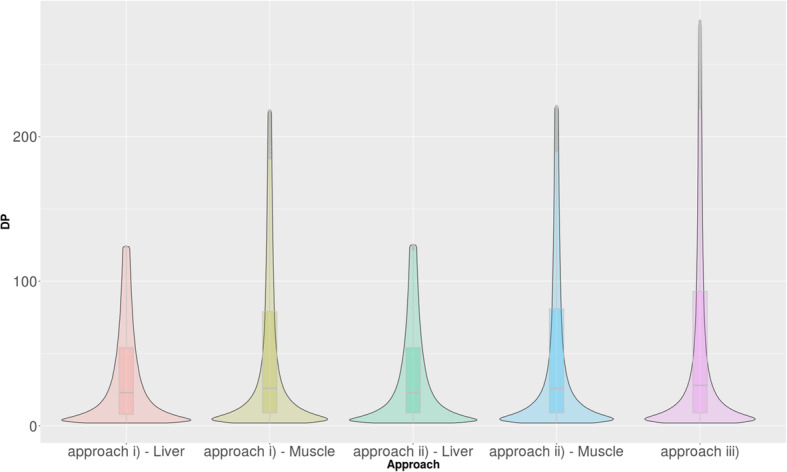
Fig. 1.

Violin plot of read coverage distribution of the variants detected in each approach. The plot is truncated after the 3rd quartile of the original read coverage distribution from each sample in order to improve the visualization due to the large number of observations distributed over a wide range. DP: Read depth per variant position for the corresponding approach. Approach i) non-merged samples; Approach ii) merged samples by group for low-RFI and merged samples for high-RFI for each tissue, Approach iii) merged samples by group and tissue for low- and high-RFI for both tissues.
