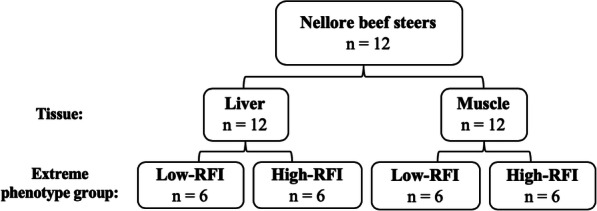
Fig. 5.

Population, tissue sample, and feed efficiency group structure using RNA-Seq data from two studies*. RFI = residual feed intake; n = sample size. Initial population sizes were n = 20 (liver) and n = 20 (muscle); however, 4 individuals were removed from each high-RFI group due to non-matching animal IDs. Additionally, 4 individuals were randomly removed from each low-RFI group to maintain a consistent sample size of n = 6 for each RFI group. *GEO Accession ID: PRJEB7696 and PRJEB15314 for liver and muscle tissue data, respectively
