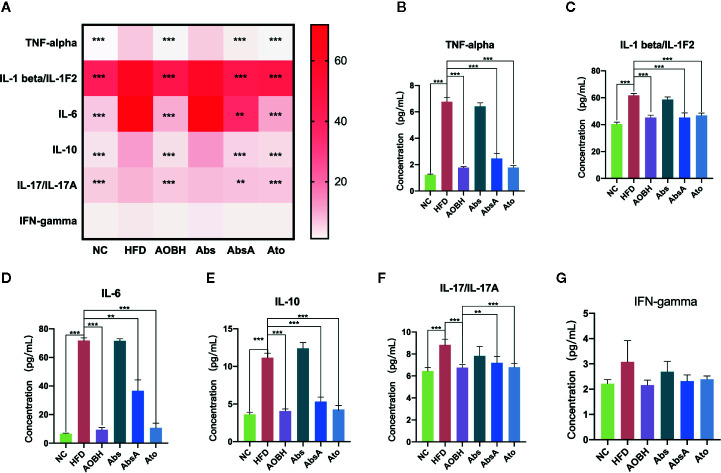
Figure 3.
AOB effects on serum cytokine levels and chemokine levels. Quantified serum cytokine levels via Mouse Magnetic Luminex Screening Assay 6 PLEX (6 specimens per group). (A) 6 cytokine and chemical level heat map. (B) TNF-alpha. (C) IL-1 beta/IL-1F2. (D) IL-6. (E) IL-10. (F) IL-17/IL-17A. (G) IFN-gamma. Values are represented as the ± standard mean deviation. ANOVA calculated disparities. Compared to the HFD community, **p < 0.01, ***p < 0.001.

