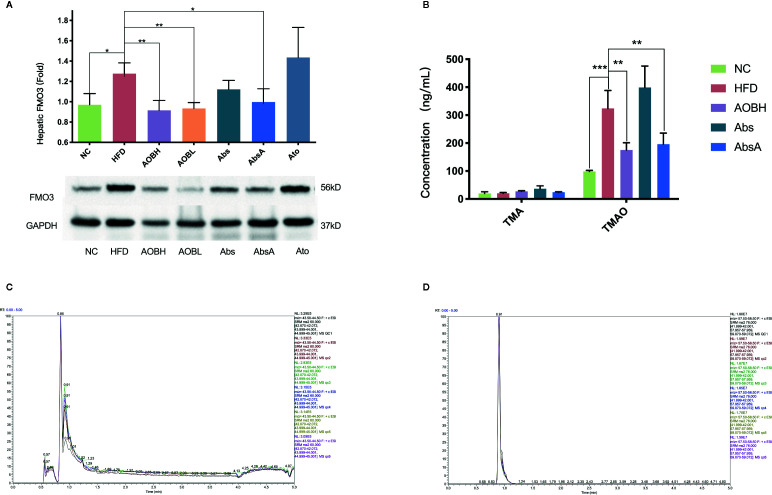
Figure 4.
AOB influences hepatic FMO3 thus decreasing the TMA and TMAO serum levels in apoE-/- mice. (A) Western blot quantified the FMO3 expression levels in mice. (B) Serum concentrations of TMA and TMAO. (C) UHPLC/MS/MS assessed serum TMA (D) and serum TMAO levels. Values are shown as the ± standard mean deviation. ANOVA calculated disparities. Compared to the HFD community, ***p < 0.05, **p < 0.01, ***p < 0.001.

