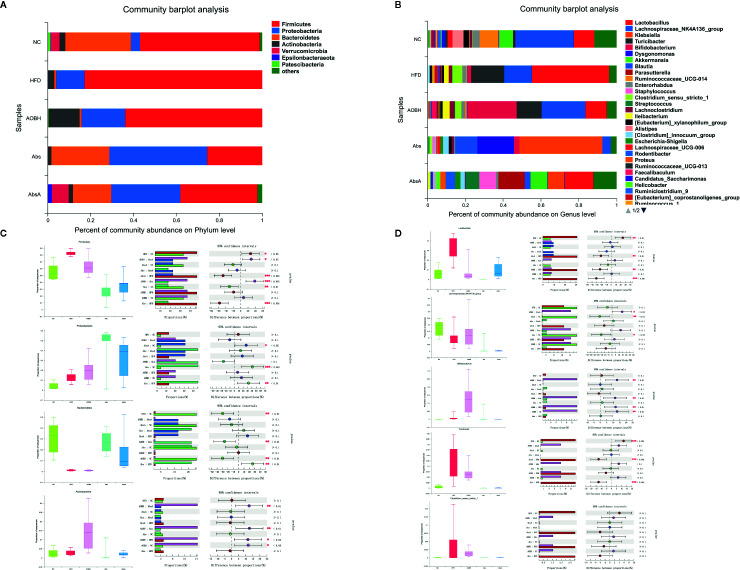
Figure 6.
Related phylum- and genus-level bacterial abundance. One-way ANOVA with Tukey-Kramer test was used to assess major group discrepancies, and false discovery rate (FDR) was used to correct multiple tests: *p < 0.05, **p < 0.01, ***p < 0.001. (A) Stacked bar plot of taxonomic levels in individual groups. (B) One-way phylum level ANOVA bar plot in each group. (C) Single-way ANOVA bar plot phylum level Firmicutes, Proteobacteria, Bacteroidetes, and Actinobacteria. (D) One-way ANOVA bar plot genus level Lactobacillus, Lachnospiraceae NK4A136 group, Bifidobacterium, Turicibacter, and Clostridium sensu stricto 1.

