Figure 1.
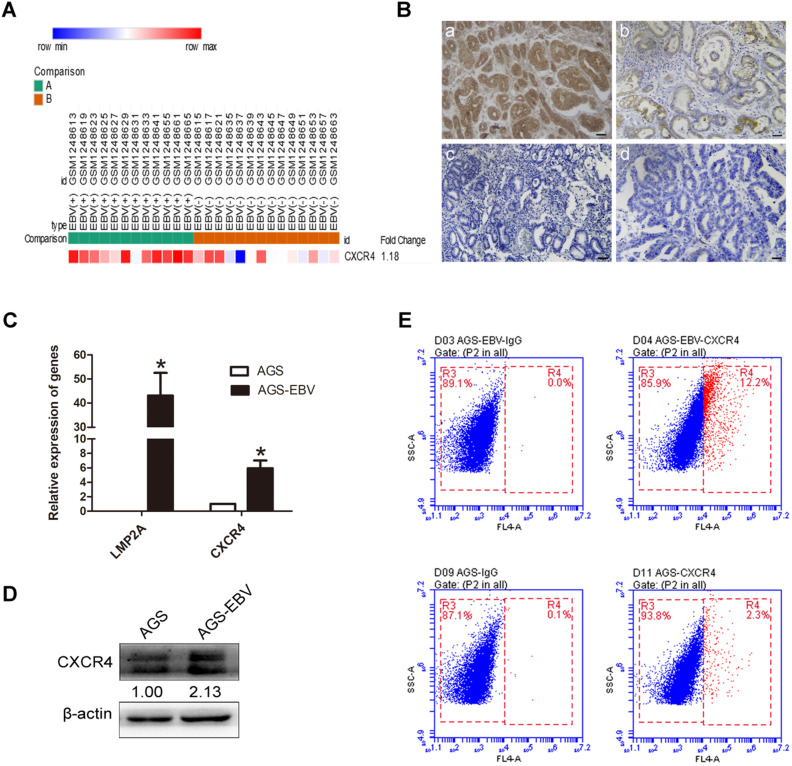
EBV induces CXCR4 expression in EBVaGC tissues and cells. (A) CXCR4 expression pattern in GSE51575 (the green group represents EBVaGC tissues, and the red group represents EBVnGC tissues). CXCR4 expression levels decrease from red to blue. (B) The expression of CXCR4 protein between EBVaGC (a, c) and EBVnGC (b, d) tissues determined by IHC. (C) Relative expression levels of LMP2A and CXCR4 mRNA in AGS and AGS-EBV cells. *p<0.05. (D) CXCR4 expression levels were analysed by Western blotting between AGS-EBV and AGS cells. β-Actin was used as a loading control. The average of three independent replicates is shown. (E) The membrane expression of CXCR4 protein was detected using flow cytometry. IgG was used as a negative control.

