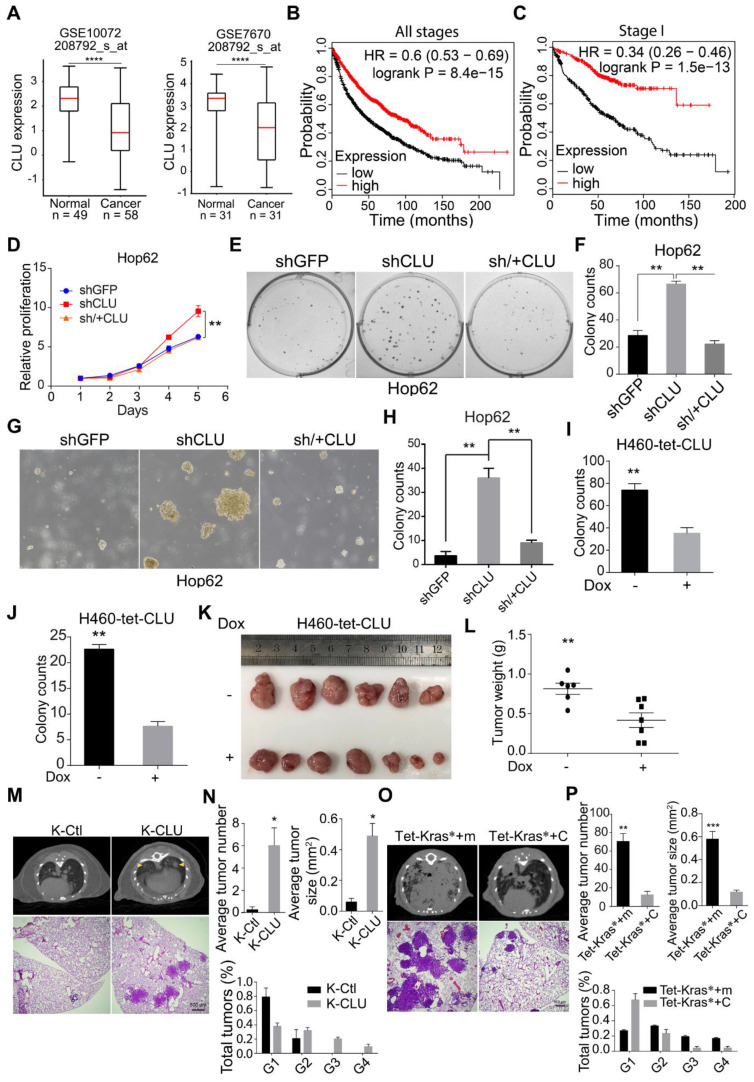
Figure 1.
CLU is an essential tumor suppressor gene in lung cancer. (A) Two published microarray data sets were analyzed to compare CLU expression in normal and tumoral tissues. GEO number and probe set were labeled on the graph. ****P < 0.00001. (B) and (C) Kaplan-Meier survival curve analysis of CLU-high and low lung cancer patients of all pathological stages B or stage I C. (D) Impact of CLU expression on growth rate of Hop62 cell. 800 engineered Hop62 cells were seeded in 96 wells plate and cultured for 5 days. Cell viability was analyzed with CCK8 assay. Statistic with two-tailed t-test on day 5. (E) Impact of CLU expression on 2-D colony formation ability of Hop62 cell. 200 engineered Hop62 cells were seed in 6 well plate and cultured for 7 days. Colonies were fixed and stained with 0.5% crystal violet in methyl alcohol. (F) Quantification of colony numbers of E. Statistic with one-way ANOVA test. (G) Impact of CLU expression on ability of Hop62 cell to form colonies in soft agar culture. 200 cells/well were seeded in 6-well plates and cultured for 14 days before imaging. (H) Quantification of G. shGFP for control knockdown; shCLU for CLU knockdown; sh/+CLU for CLU re-expression in CLU knockdown cells. (I) and (J) 2-D Plate and soft agar colony formation assay of indicated groups in H460 cell. CLU expression was induced with 1 ug/mL Dox. For 2-D colony formation assay, 200 cells/well were seed in 6 well plate and cultured for 7 days. Colonies were fixed with methanol and stained with 0.5% crystal violet. For soft agar colony formation, 200 cells/well were seeded and culture for 14 days before imaging. Two-tailed t-test. (K) Impact of CLU expression on ability of H460 to form xenograft tumor in nude mouse. H460 cells (2 million) were subcutaneously implanted on nude mice followed by Dox-diet treatment. Tumors were harvested 25 days post implantation. Each group n > 6. (L) Weight of tumor in K, two-tailed t-test. (M) Impact of CLU expression on tumor formation in lsl-KrasG12D/+ transgenic mice. Lentivirus of pSECC-sgCLU and pSECC-TdTomato were administered through nasal instillation into lsl-KrasG12D mice to induced lung cancer, designated K-CLU and K-Ctl respectively. Lung tumor formation in K-CLU mice were compared to K-Ctl mice 13 weeks post-infection. Upper panel: Computed tomography (CT) images of lung of KrasG12D/+ mouse; Lower panel: hematoxylin and eosin (H&E) staining of lung sections of KrasG12D/+ mouse. K-Ctl for KrasG12D/+/sgControl; K-CLU is KrasG12D/+/sgCLU, each group n > 6. (N) Quantification of average total tumor number, tumor size and the percentage of G1-G4 tumors for M. (O) Impact of CLU expression on tumor formation in CC10rtTA /Tet-KrasG12D transgenic mice. Upper panel: Computed tomography images of lung of CC10rtTA /Tet-KrasG12D transgenic mice; Lower panel: H&E staining of lung sections of Tet-KrasG12D transgenic mice. CC10rtTA/ Tet-KrasG12D mice infected with lentivirus harboring Tet-mCherry (Tet-Kras*+m, serving as negative control) or lentivirus harboring Tet-CLU (Tet-Kras*+C) were fed with Dox diet for 2 months. Each group n > 6. (P) Quantification of average total tumor number, tumor size and percentage of G1-G4 tumors of O, statistics with two-tailed t-test. All the transgenic mice here were C57BL6 background, about 6-8 weeks old without sex limited. *P < 0.05, **P < 0.005, ***P < 0.0001; Data plotted are mean ± s.e.m.; n = 3.

