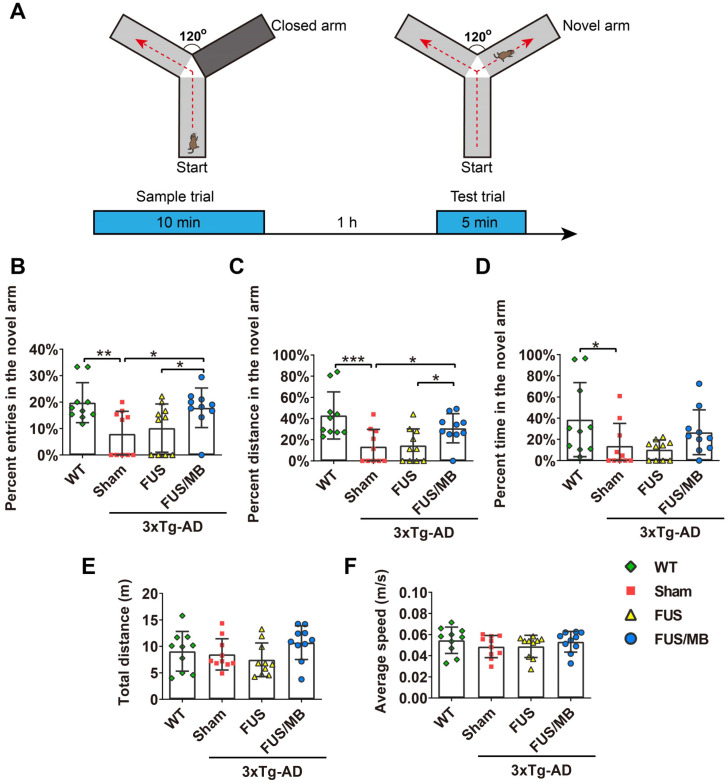
Figure 3.
The performance of the mice in the Y-maze test. (A) Illustration of the Y-maze and the timeline of sample and test trial phases. (B-D) The percentage of entries, distance and time in the novel arm over all the arms in the WT, sham, FUS and FUS/MB group during the test trial phase. Following six weeks of FUS/MB treatment, the 3×Tg-AD mice showed significant increase in the percentage of entries into the novel arm (17.8% ± 7.4%) by 2.2-fold compared with the sham group and 1.7-fold (8.0% ± 8.0%, p < 0.05) compared with the FUS group (10.2% ± 9.1%, p < 0.05). The average percentage of the distance traveled in the novel arm of the FUS/MB group was 30.8% ± 13.8%, which was 2.3 times and 2.1 times that of the sham group (13.4% ± 16.3%, p < 0.05) and FUS group (14.5% ± 15.6%, p < 0.05), respectively. Albeit with no significance, the FUS/MB group showed on average, prolonged time in the novel arm (26.6% ± 21.2%), compared with the sham-treated (13.7% ± 21.2%, p =0.227) and FUS-treated (10.2% ± 9.1%, p = 0.126) 3×Tg-AD mice. (E-F) Total distance and the average speed of the animals traveled in all the arms. Statistical analysis revealed no significant differences in the total distance and average speed between groups, indicating no motor impairments in the 3×Tg-AD mice. n = 10 for each group. Data were presented as mean ± SD. *: p < 0.05, **: p<0.01, ***: p< 0.001.

