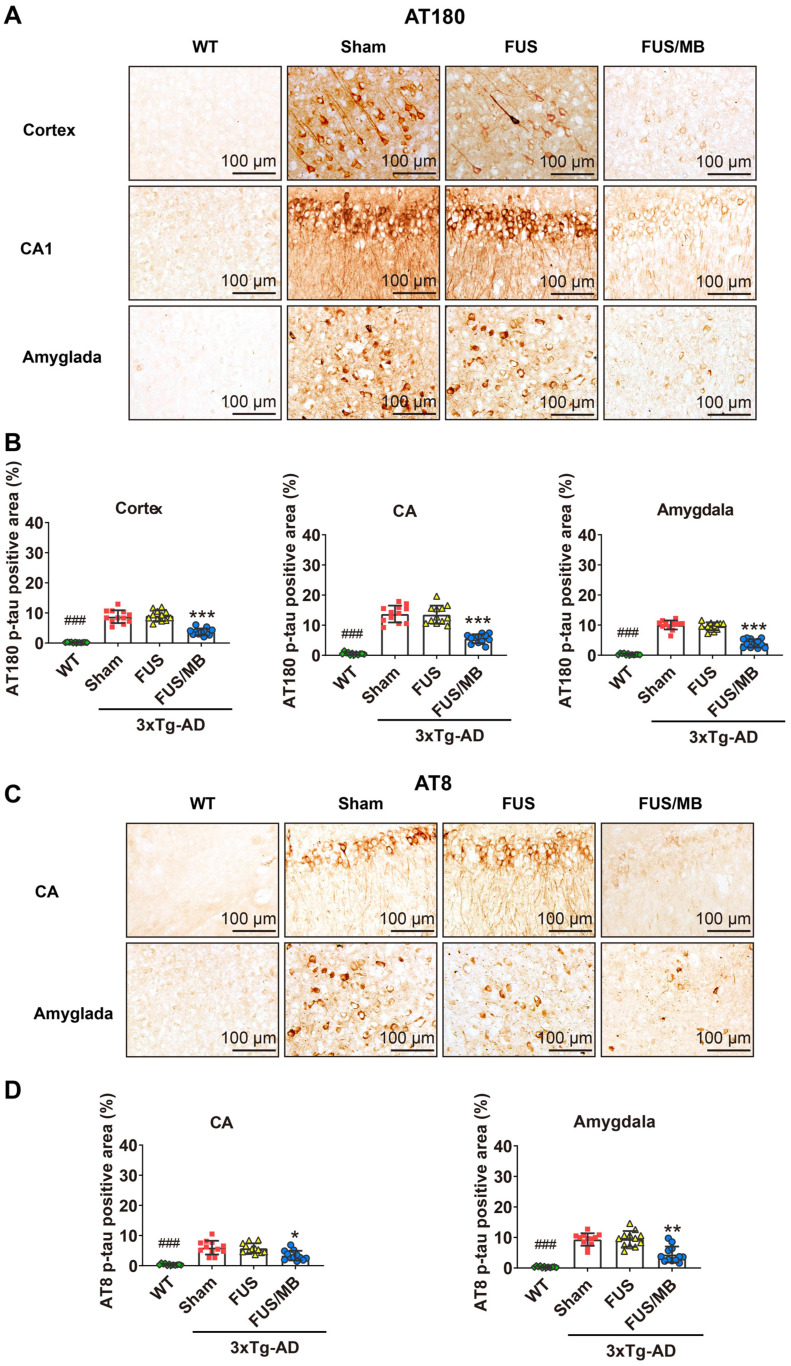
Figure 7.
Phosphorylated tau stained with AT180 or AT8 in the brain sections from 3×Tg-AD mice in the sham, FUS and FUS/MB group, as well as the WT mice. (A) Representative immunohistochemical images against AT180 of the sonicated hemisphere in the FUS/MB group and ipsilateral sides in other three groups. AT180 p-tau pathology was evident in the cortex, hippocampus and amygdala of the sham-treated and FUS-treated 3×Tg-AD mice. Notably, the FUS/MB group showed reductions in the AT180-immunoreactive signals. Scale bar: 100 µm. (B) Quantitative analysis of AT180-positive areas in the cortex, CA region and amygdala of the ipsilateral hemispheres in the four groups. The AT180-positive areas of the sham group in the cortex, CA region and amygdala were 8.7% ± 2.1%, 13.7% ± 2.8%, and 10.1% ± 1.5%, which were reduced to 3.7% ± 1.1%, 5.5% ± 1.5%, and 4.0% ± 1.4% after FUS/MB treatment, representing reductions of 57%, 60%, and 60%, respectively. There was no difference between the sham and FUS groups. (C) Representative immunohistochemical images against AT8 of the sonicated hemisphere in the FUS/MB group and ipsilateral sides in other three groups. AT8 p-tau pathology was evident in the hippocampus and amygdala of the sham-treated and FUS-treated 3×Tg-AD mice. FUS/MB treatment also induced amelioration of the AT8-posoitive signals. Scale bar: 100 µm. (D) Quantitative analysis of AT8-positive areas in the CA region and amygdala of the ipsilateral hemispheres in the four groups. AT8-immunoreactive areas were decreased in CA and amygdala of the 3×Tg-AD mice after FUS/MB treatments by orders of 45% and 53% compared with the sham group. There was no difference between the sham and FUS groups. Three brain sections per animal were used. *, **, ***: p < 0.05, <0.01, < 0.001, vs. WT or sham or FUS. ###: p < 0.001, vs. sham or FUS or FUS/MB.

