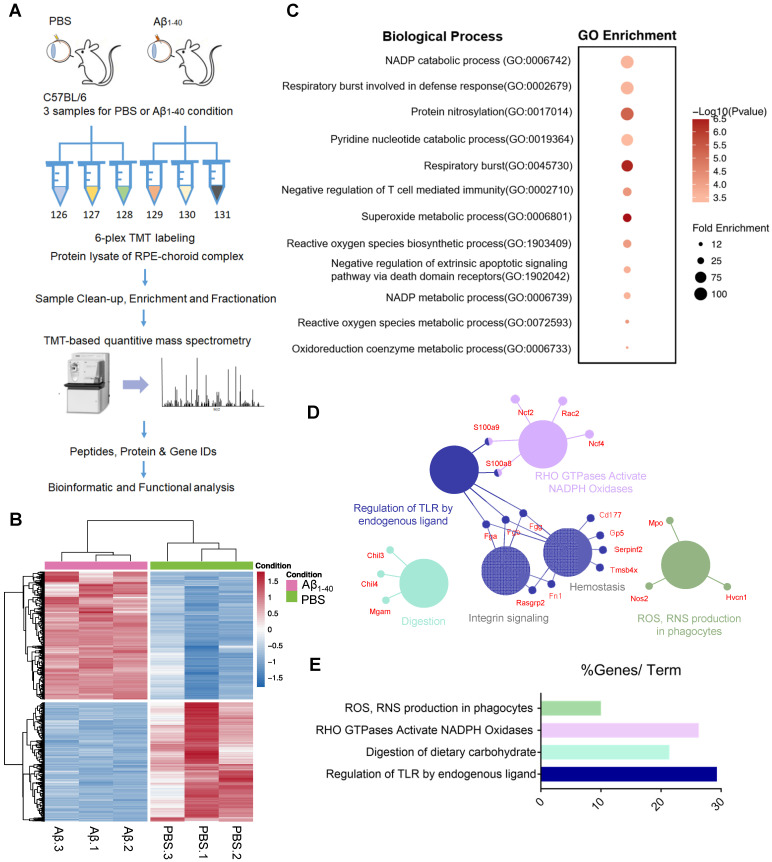
Figure 2.
Proteomic analysis of the RPE-choroid complex from Aβ1-40- or PBS-treated mice using TMT-based isobaric labeling. (A) Schematic of the workflow of TMT and multi-omics analyses. (B) Heatmaps of differentially expressed proteins (DEPs) (-0.5 < log2FC < 0.5 and P ≤ 0.05) excluding cytoskeleton-related proteins (red, upregulation; blue, downregulation; n=3). (C) GO enrichment analysis of the top 100 most highly upregulated DEPs; major GO terms were enriched in oxidation-related biological processes. (D, E) Functional pathway analysis with the ClueGO and CluePedia Cytoscape plugins with the Reactome pathways database showing overrepresented pathways related to ROS production.

