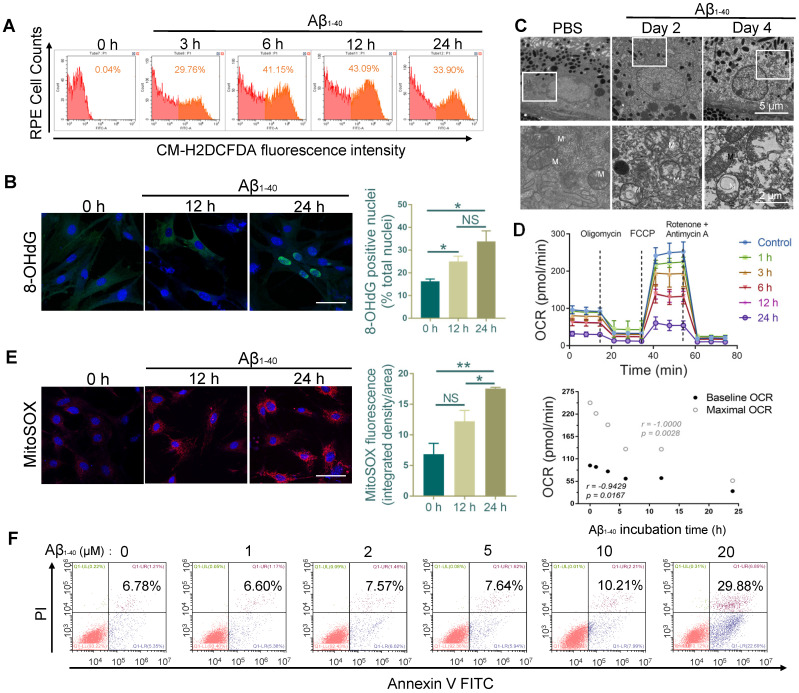
Figure 4.
RPE cell oxidation and impaired mitochondrial functions after Aβ1-40 treatment. (A) Primary mouse RPE cells were treated with Aβ1-40 (2 µM) for 0, 3, 6, 12 h, and 24 h before incubation with CM-H2DCFDA. Flow cytometry was used to detect the fluorescence intensity. (µ) Representative frozen RPE cell sections stained at 0 h, 12 h, and 24 h after Aβ1-40 treatment for immunoreactive 8-hydroxy-deoxyguanosine (8-OHdG, green). Nuclear 8-OHdG expression was quantitated as a percentage of the total nuclei. Scale bar = 50 µm. (C) TEM images of changes in the morphology and mitochondria of RPE cells at 2 and 4 days after intravitreal Aβ1-40 injection. The lower parts of the images are magnified portions of the corresponding upper images (enclosed in white boxes). M, mitochondria; scale bar = 5 µm (upper portion) and 2 µm (lower portion). (D) The OCRs of primary mouse RPE cells after incubation with Aβ1-40 for different time periods (0 h, 1 h, 3 h, 6 h, 12 h, and 24 h) in the presence of oligomycin, FCCP, and rotenone were measured using a Seahorse XF24 analyzer (n=5). Average basal and maximal OCRs were calculated as the mean of the measurements at 3 time points. The basal and maximal OCRs were negatively related to the Aβ1-40 incubation time. (E) Representative confocal microscopy images of primary mouse RPE cells stained with MitoSOX Red at 0 h, 12 h, and 24 h after Aβ1-40 treatment. Scale bar = 50 µm. (F) Apoptosis analysis in primary mouse RPE cells after incubation with Aβ1-40 at different concentrations (0 µM, 1 µM, 3 µM, 6 µM, 12 µM, and 24 µM) was performed by flow cytometry with annexin V/PI double staining. All data are presented as the mean ± SEM; NS = nonsignificant, *P < 0.05, **P < 0.01. Student's t-test (B, E) and Spearman's correlation analysis (D) were performed using GraphPad Prism software.

