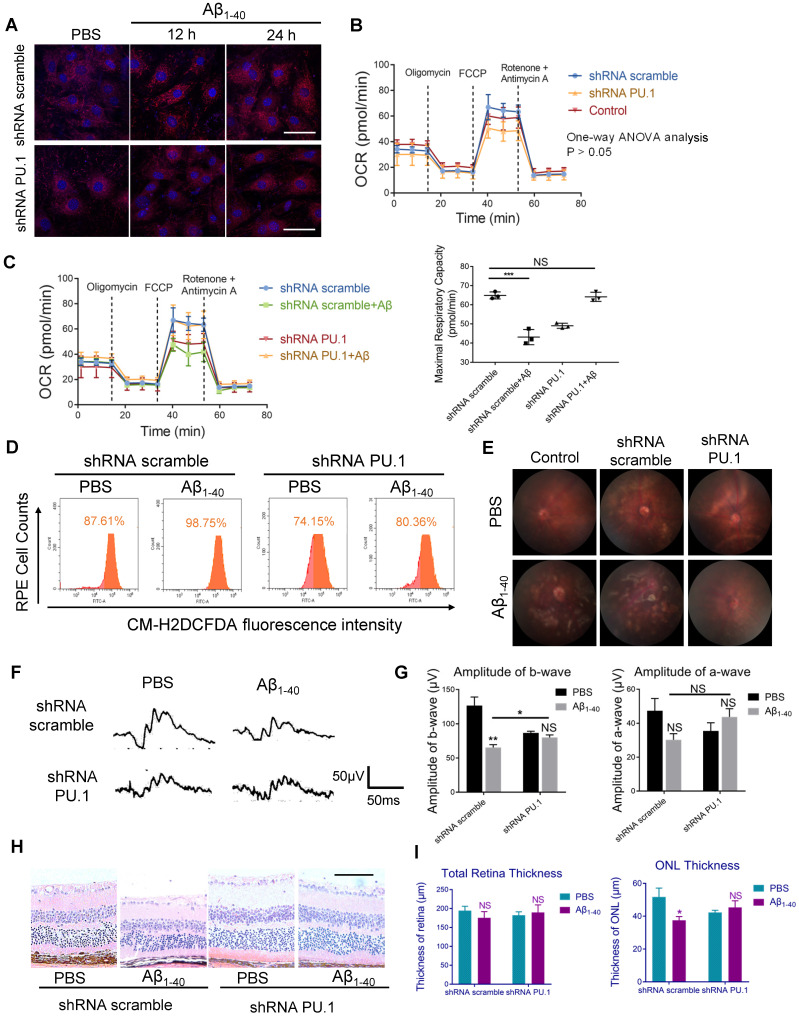
Figure 8.
PU.1 regulates RPE oxidative stress, causing Aβ1-40-induced RPE degeneration. (A) Representative images of MitoSOX Red-stained primary mouse RPE cells transduced with PU.1/scramble shRNA lentiviruses at 0 h, 12 h, and 24 h after Aβ1-40 treatment. Scale bar = 50 µm. (B) The OCRs of primary mouse RPE cells in the scramble shRNA-treated group, PBS-treated (control) group, and PU.1 shRNA-treated group had no difference. P > 0.05 for all time points from 1 to 75 min (one-way ANOVA). (C) OCRs of the PU.1 shRNA-treated group and scramble shRNA-treated group at 24 h after Aβ1-40 treatment. The average maximal OCR/antimycin- and rotenone-induced OCR was calculated as the mean of the values at 3 time points (40-54 min); n = 3. (D) The CM-H2DCFDA fluorescence intensity was detected in primary mouse RPE cells transduced with lentivirus carrying PU.1 shRNA for 72 h followed by Aβ1-40 incubation for 12 h. (E) Fundus photography of the eyes of mice subretinally injected with lentiviruses carrying scramble shRNA or PU.1 shRNA 4 days after Aβ1-40 or PBS treatment. (F, G) Representative traces from ERG recordings of mice subretinally injected with lentivirus 4 days after the injection of Aβ1-40. The corresponding a- and b-wave amplitudes are shown in (G). (H) Representative retinal sections within 200 µm from the optic disc in mice subretinally injected with lentiviruses carrying scramble shRNA and PU.1 shRNA 4 days after Aβ1-40 or PBS treatment. Scale bar = 50 µm. (I) Changes in the thickness of the ONL and the total retinal thickness in (H). All data are presented as the mean ± SEM; NS = nonsignificant, *P < 0.05, ***P < 0.001, Student's t-test (C, G and I) and one-way ANOVA (B) were performed using GraphPad Prism software.

