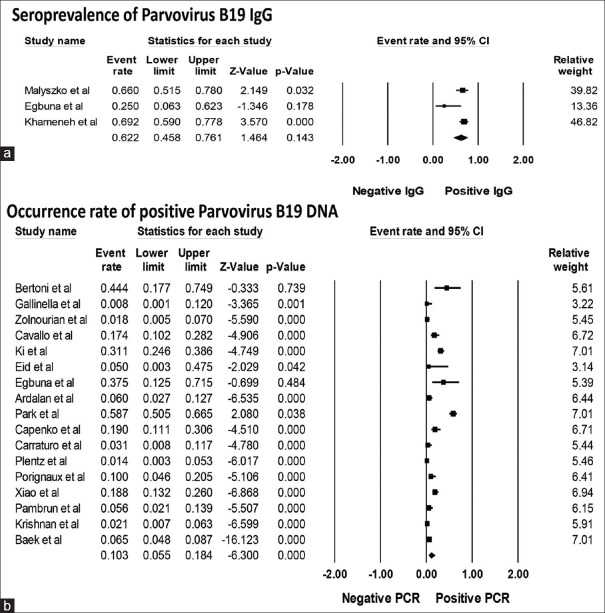
Figure 2.
Forest plots of the included studies assessing. (a) Seroprevalence of parvovirus B19 immunoglobulin G and (b) incidence rate of positive parvovirus B19 DNA in kidney transplant patients. A diamond data marker represents the overall rate from each included study (square data marker) and 95% confidence interval

