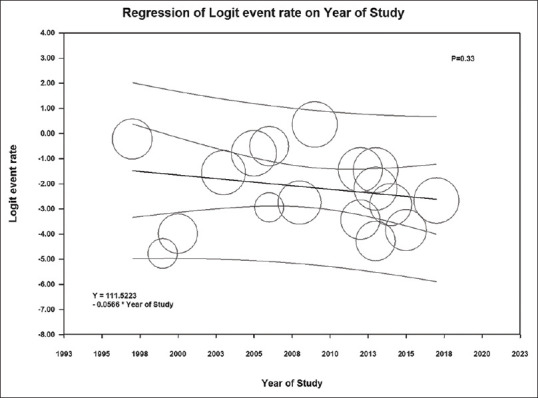
Figure 4.

Meta-regression analysis demonstrated no significant correlations between the year of study and the incidence rate of positive parvovirus B19 DNA (P = 0.33). The solid black line represents the weighted regression line based on variance-weighted least squares. The inner and outer lines show the 95% confidence interval and prediction interval around the regression line. The circles indicate log event rates in each study
