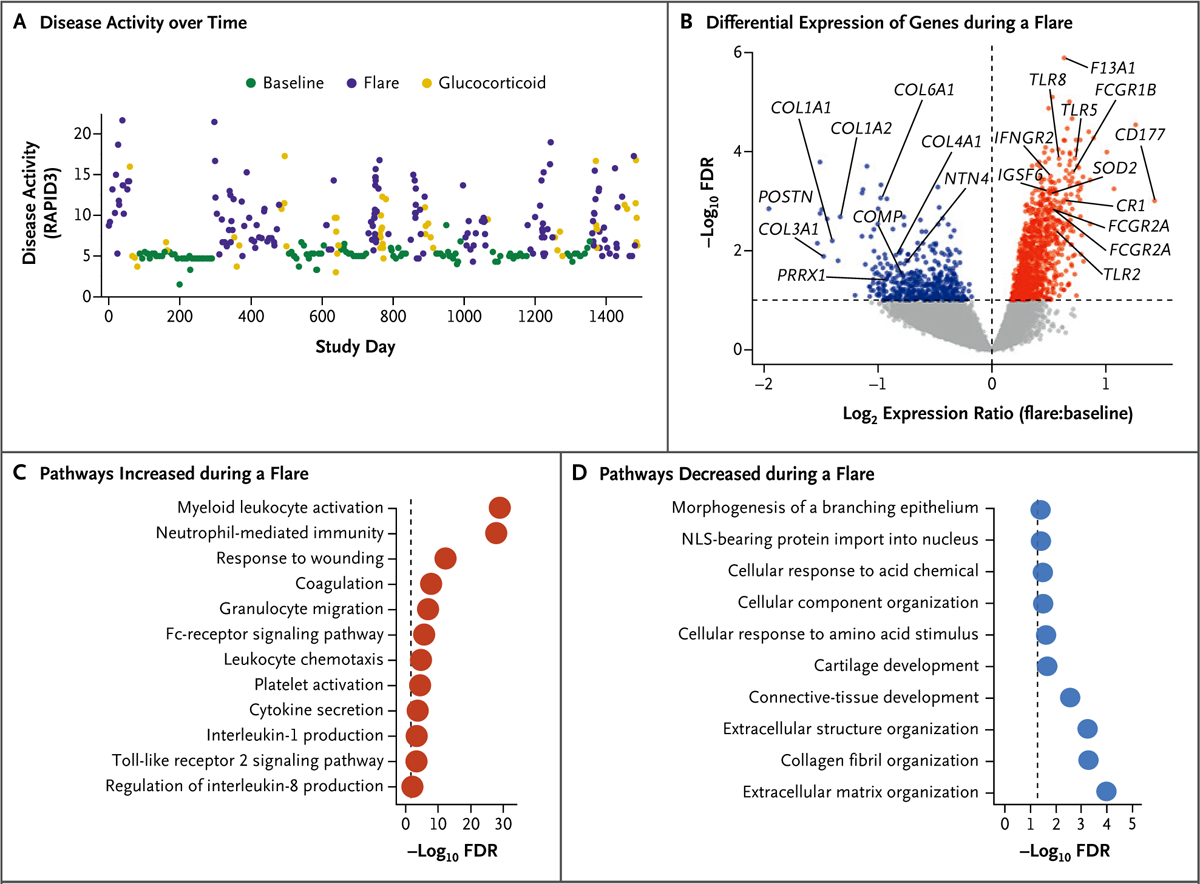
Figure 2. Clinical and Transcriptional Characteristics of Rheumatoid Arthritis Flares in the Index Patient.

Panel A shows disease activity (measured with the RAPID3 questionnaire; 356 scores included in the analysis) over the course of 4 years in the index patient. Panel B shows a volcano plot of differential gene expression during flares (46 specimens) and during baseline (33 specimens), with significance (−log10 false discovery rate [FDR]) plotted against the log2 relative expression (flare:baseline ratio). Gray points indicate genes with no significant difference in expression between flares and baseline (with FDR >0.1), red indicates genes with significantly increased expression during a flare (FDR <0.1 and log2 expression ratio >0), and blue indicates genes with significantly decreased expression during a flare (FDR <0.1 and log2 expression ratio <0). Panels C and D show pathways enriched among genes with significantly increased (Panel C) or decreased (Panel D) expression during a flare relative to baseline. The dashed line represents the threshold for significance (FDR <0.05, or −log10 FDR >1.3). NLS denotes nuclear localization signal.
