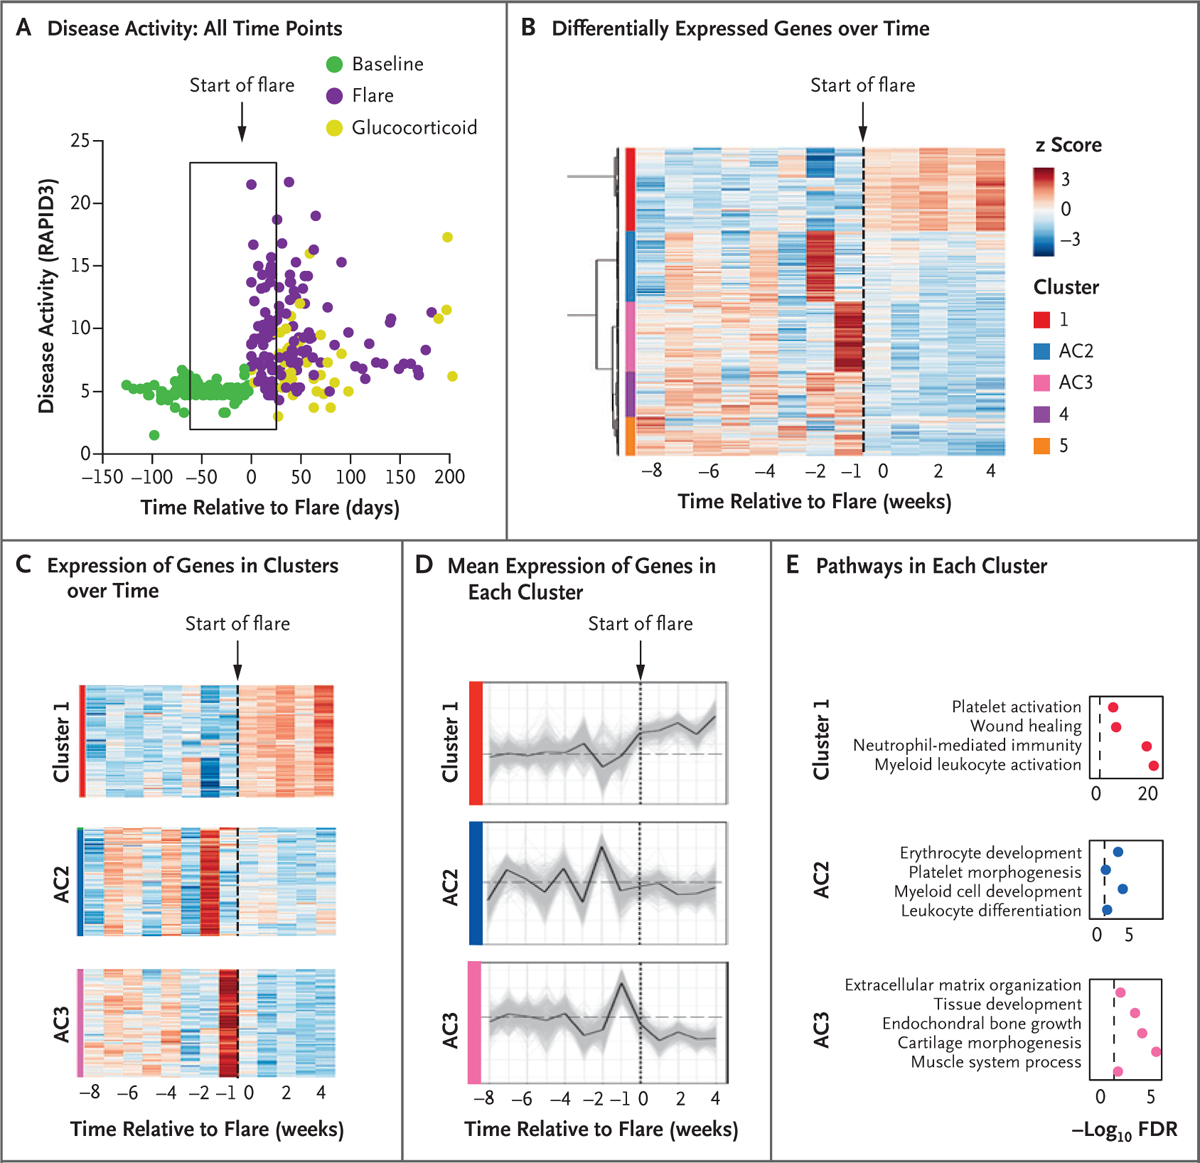
Figure 3. Transcriptional Characteristics of Immune Activation before Symptom Onset in Rheumatoid Arthritis Flares.

Panel A shows RAPID3 disease-activity scores over time (measured in days). The box represents disease activity from day −56 to day 28 relative to the start of a flare (day 0). Panel B shows hierarchical clustering of z scores of 2791 significantly differentially expressed genes over time. Significant clusters are labeled by color. Antecedent cluster 2 (AC2) and AC3 refer to clusters of genes with expression that changed before flares. Panel C shows a detailed representation of the cluster 1, AC2, and AC3 genes depicted in Panel B over the time to a flare. Panel D shows the mean standardized cluster gene expression over the time to a flare. Light gray lines represent expression of individual genes in the cluster. The dashed horizontal line represents the mean baseline gene expression (weeks −8 to −4). Panel E shows pathways enriched in cluster 1, AC2, and AC3. The dashed vertical line represents the threshold for significance (FDR <0.05, or −log10 FDR >1.3).
