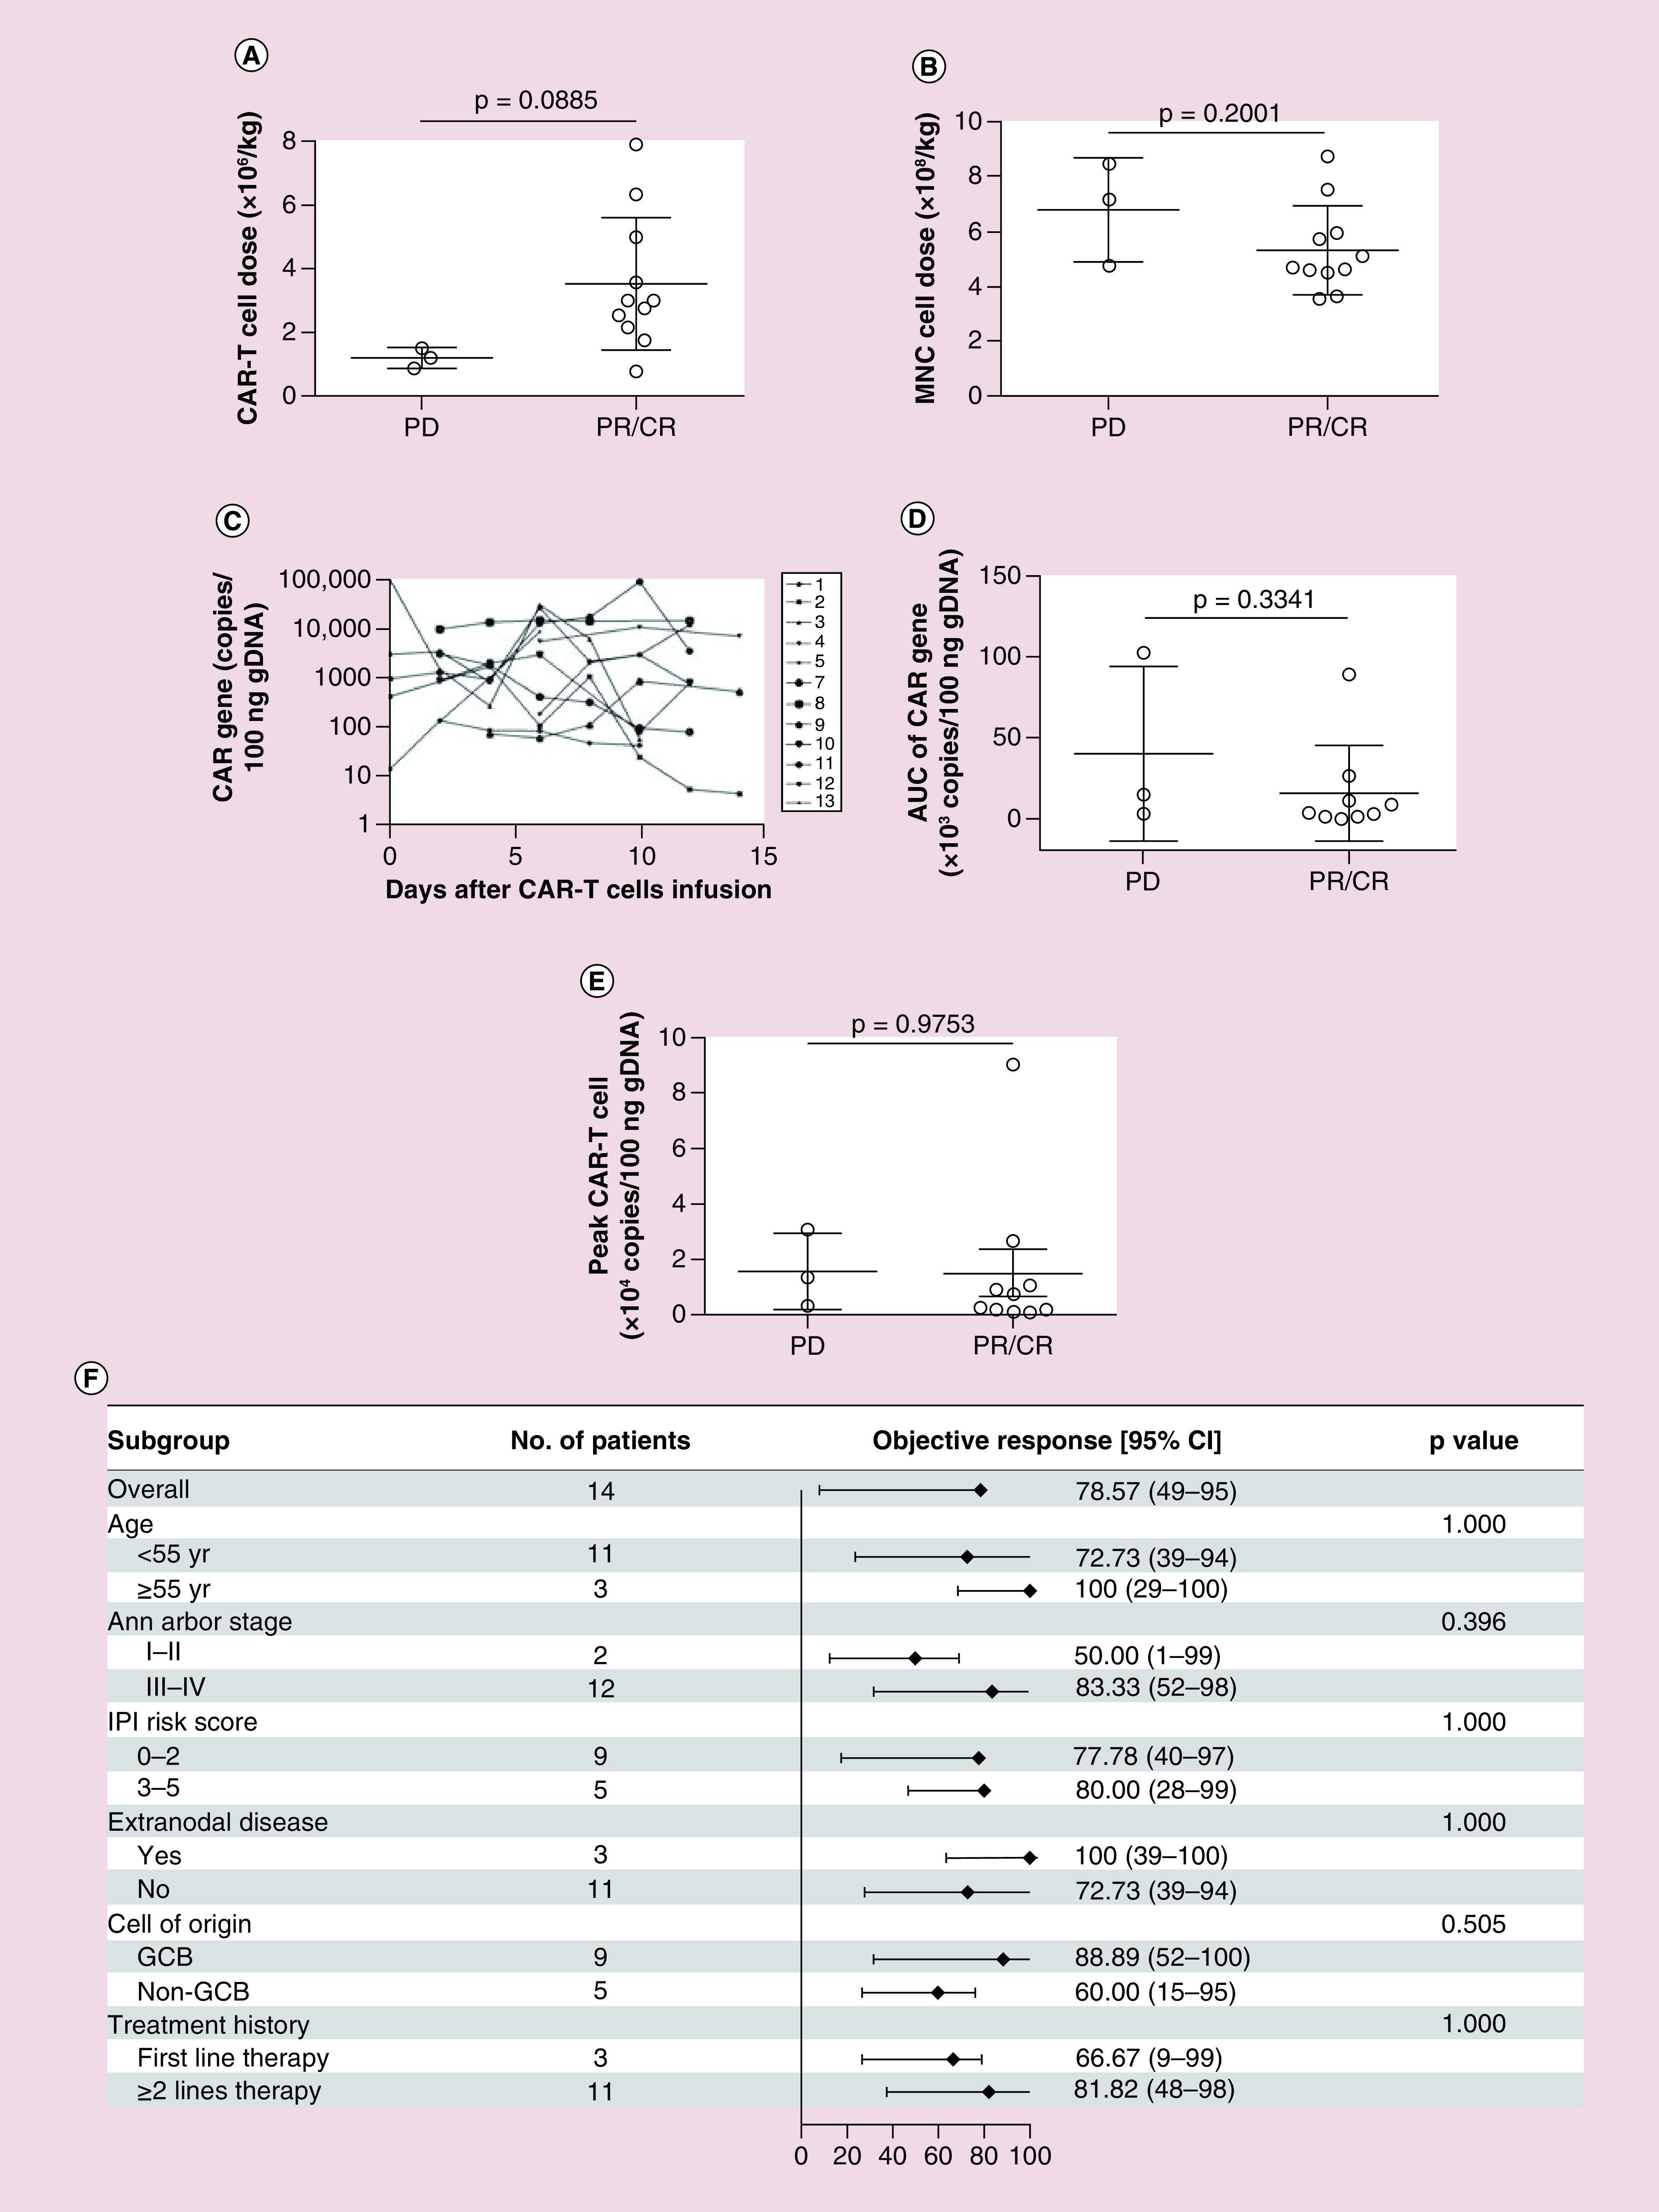
Figure 2. . Patient response and possible relevant factors.

(A) Relationship of patient responses of PR/CR or PD to CAR T-cell dosage. (B) Relationship of patient responses of PR/CR or PD with infused MNC dosage. (C) CAR T-cell expansion detected by qPCR from day 1 through day 14 after T-cell infusion. (D) Relationship of patient response to CAR expansion in vivo AUC. (E) Relationship of patient responses of PR/CR or PD to CAR T-cell peak/expansion level in vivo. (F) The rate of objective response (CR + PR) and 95% CI according to patient baseline clinical characteristics including the age, Ann Arbor stage, IPI risk score extranodal disease, cell of origin and treatment history. Solid diamond indicates the observed objective response rate. Line extended from diamond means 95% CI.
AUC: Area under curve; CAR: Chimeric antigen receptor; CR: Complete remission; GCB: Germinal center B cells; IPI: International prognostic index; MNC: Mononuclear cell; PD: Progressive disease; PR: Partial remission; qPCR: Quantitative-PCR.
