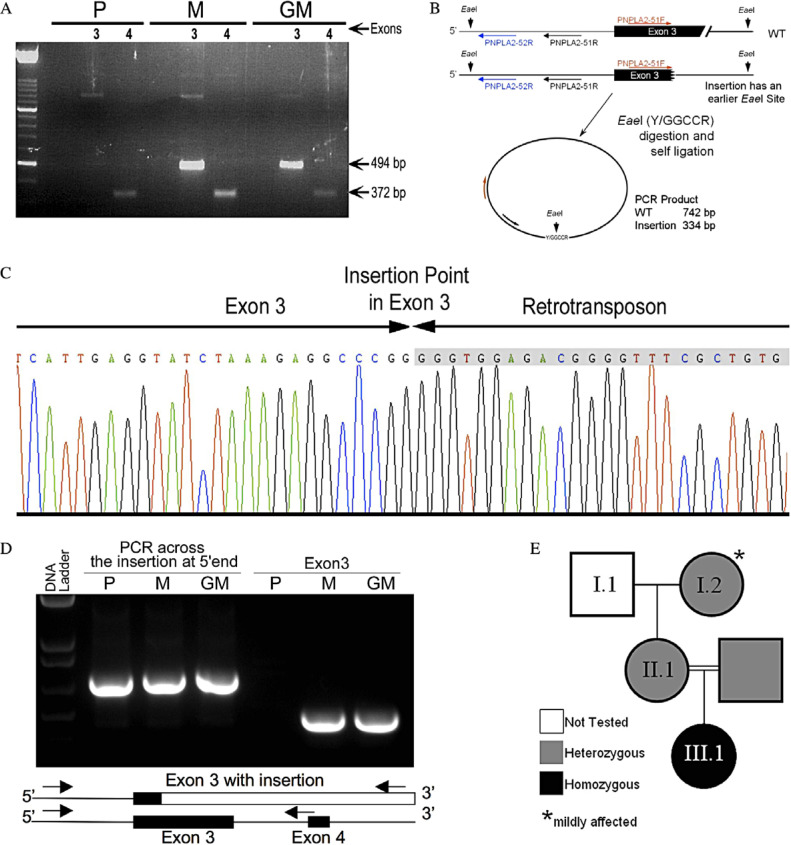
Fig. 4.
Molecular analysis of the PNPLA2 gene. (A) PCR amplification of exons 3 and 4 of the PNPLA2 gene from the genomic DNA of the patient (P), her mother (M), and grandmother (GM). (B) Diagram of the inverse PCR reaction strategy. (C) Electropherogram of inverse PCR products shows partial sequences of PNPLA2 exon 3 and of the 5′-sequence of the retrotransposon. (D) Agarose gel of PCR fragments showing amplified fragments across the insertion point (from the 5′ end of exon 3 to the transposon) and exon 3 only. The diagram below shows the map of the locus and the locations of the PCR primers. (E) Pedigree of the family based on molecular data.

