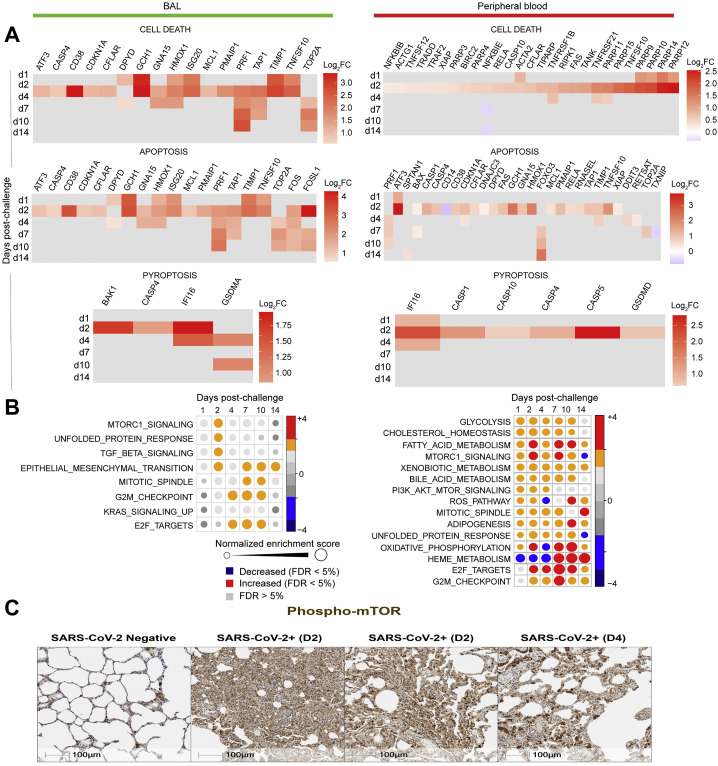
Figure S6.
Molecular Signatures of Cell Death and Apoptosis and Metabolism Increased in BAL and Peripheral Blood of SARS-CoV-2-Infected Macaques, Related to Figure 4
(A) Checkboard plot of cell death, apoptosis, and pyroptosis increased by SARS-Cov-2 in BAL (left panel) and in peripheral blood (right panel) on days 1, 2, 4, 7, 10 and 14. Color gradient corresponds to the log2 fold change expression on days 1, 2, 4, 7, 10 and 14 compared to baseline. All markers were selected using a BH-adjusted p < 0.05.
(B) Circles plot representation of the GSEA normalized enrichment score (NES) of metabolism signatures (left panel: BAL; right panel: peripheral blood) increased by SARS-CoV-2. An NES greater than 0 (in red) corresponds to a pathway for which member genes are increased by SARS-CoV-2, an NES below 0 (in blue) corresponds to a pathway for which member genes are decreased by Sars-CoV-2. An NES > 0 (in red) corresponds to a pathway for which member genes are increased by Sars-CoV-2. The size and the color of each circle is proportional to the NES, where color gradient ranging from blue (decreased), gray (not significant: FDR > 5%) and red (increased).
(C) Rhesus macaques were necropsied before (SARS-CoV-2 negative) or after high-dose SARS-CoV-2 challenge on day 2 (D2) and day 4 (D4) following challenge. Serial sections of lung tissue showed increased expression of phosphorylated mTOR (Phospho-mTOR). Scale bars = 100 μm.

